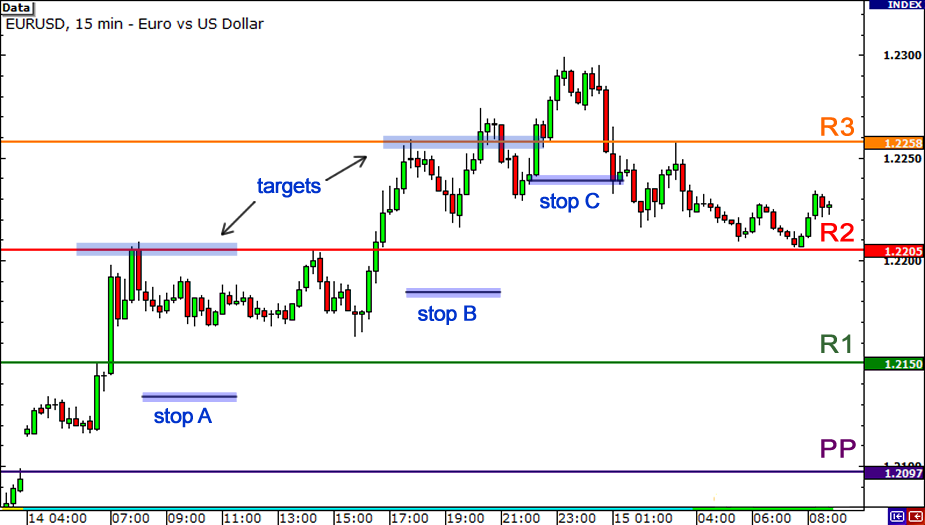
Those who are familiar with technical analysis of charts have come across such a thing as trading at a turning point, or Pivot Points, which is a trading indicator that is used to measure the trend of the market in a certain period of time. Simply put, the Pivot Point is calculated taking into account the daily low and high positions, as well as the nearest positions from the previous session. This value may vary, however, depending on the time frame. So, if we look at the graph for the hour, the calculated interval is equal to the previous hour. In a weekly chart, the calculated interval would be the interval for the previous week.
- Pivots are often used in binary options strategies to identify strong pivot points, support and resistance lines.
Look for solid traders with the right broker during the turning point
Identification of important changes in the direction of price movement.
The Pivot Point marker is used to determine the price in case you need to know potential changes in price movement. If prices are above the Pivot Point, a bullish movement prevails in the market, prices are likely to move in the upward direction. If prices are below the Pivot Point, the bearish direction prevails in the market, most likely, prices will fall further.
Understanding the trends with which prices will move in the future can be extremely valuable when trading binary options, and if these directions in motion are predicted with sufficient accuracy, you can make significant profits in a fairly short period of time.
Support and resistance levels
Pivot Points are the most useful in identifying support and resistance levels.
In many cases, support and resistance are calculated using the pivot price level and marking the difference between the high and low price marked in the previous session. If the price breaks through one of these areas (upwards or downwards), the next support and resistance level will be calculated taking into account the distance between the high and low values of the price level marked in the previous session.
When the price breaks out of a support or resistance level in the upward direction, we will be dealing with a secondary level of resistance/price support.
Use this information when trading
For those traders who are trying to understand more deeply the information about the exact formulas that would help calculate Pivot Points, a search on the Internet will bring significant results in the form of a variety of formulas. But with modern trading platforms, your platform will help you calculate itself, as well as make notes in the price movement chart of the asset you are interested in. As soon as these levels become visible, we can begin to use this information when placing trades on binary options.
When we deal with binary options, we always strive to determine in which direction the price of the asset we are interested in will move. If we have reason to believe that the price will rise, we buy a CALL option.

- Many traders trade only on PIVOT POINT.
If, on the contrary, we have reason to think that the price will fall, we purchase a PUT option. Pivot Points can be very useful in making such forecasts, as they themselves mark the first level of support or resistance. As soon as the price rises above this level (or falls below this level), we can already determine the direction of price movement. The pivot area itself is the most significant area for pricing, so we can expect that once the level is passed, the price movement can become very sharp.
So, in a bullish movement, (CALLS) we expect prices to rise above the pivot and continue to rise higher until they reach the next resistance level. At this point, trading should be closed and profits should be withdrawn. If a bearish trend (PUTS) prevails, we will expect prices to fall below the pivot level and will continue to fall until they reach the next support level. At this point, you should exit the auction.
Takeaways: Using Pivots to Determine Future Direction
Pivot Points can be a wonderful tool for traders who are trying to determine the general direction of market trends. Modern trading platforms easily point to these points, and once you’ve marked them, these areas can have a huge impact in helping a trader determine whether they should choose a CALL or PUT for a particular asset.
And one more important point – it should be remembered that Pivot Points are short-term indicators, and these levels will change after each session. That is why traders should adhere to this trend at a certain time, since the direction of price movement will become less predictable in subsequent time intervals.
Trade only with trusted brokers >>
Tagged with: Binary Options Strategy • Binary Strategy for No Touch Options


