The RSI is used in many binary strategies and is often referred to by traders as an indicator that works. The relative strength indicator was invented by W. Weider, a well-known analyst and today is considered one of the most popular oscillators that are most often used for technical analysis. In binary options, RSI has become one of the favorite indicators that traders use in almost all their strategies.
How to set up RSI on a chart?
To use the indicator in a strategy, you need to switch to live charts for options analysis.
- In the left corner, select an asset (currencies are best suited for the strategy)
- Choose a time interval for trading
- Click on the picture “Indicator” and select the RSI indicator
After these steps, the indicator will appear at the bottom of the chart:

We take a certain period of time, a certain trading instrument, that is, an asset, and compare the lows and highs of the asset price for the selected period of time:
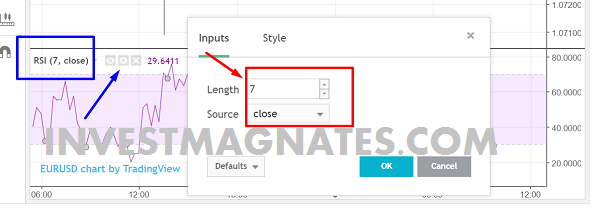
 In this strategy, the RSI must set the period with a value of 7 (instead of the standard 14). Click on the gear in the left corner, you will see a window in which you need to change 14 to 7. The RSI graph itself is a curve showing changes in the range from 0 to 100.
In this image, the blue arrows indicate the direction of the trend, the squares indicate the overbought and oversold zones. If the line crosses the 30 mark, the price will go up, if the line crosses the 70 mark, the price will fall:

Best Indicator for Options: Why RSI?
RSI is very easy to use, to get started you just need to change only one parameter – a period of time. The indicator indicates the strength of the growth or fall of the trend in the market. In trading, it is used as the main indicator for obtaining signals, and it can also be used as a filter for false signals.
How to trade with a binary strategy based on RSI?
After setting up the indicator, you can start trading. Again, pay attention to the parameters of the strategy:
- The period of the RSI is 7
- Strategy time frame: no more than 15 minutes.
 Strategy signals:
- If the RSI curve on the chart has broken through the 70 mark and headed up, this means that the market is overbought and the price of the asset will soon change direction, it is worth buying put options.
- If the RSI curve falls below 30, it means that the market is oversold, the price of the asset will soon change direction, it is worth buying call options.
It is best to work with RSI when there is no trend in the market, there is a sideways movement.
In order to use the RSI in the presence of a trend, you will have to combine it with additional indicators. If this is not done, then you will receive a lot of false signals and only waste time, and most importantly, money.
The RSI is very useful in cases where you need to determine when to buy binary options on market reversals.
What to do to make your RSI-based binary options strategy profitable? First, you need to choose a reliable trading terminal based on the ratings of brokers.
The strategy we offer is effective and multicurrency, with the correct definition of the trend, it showed a result of 74%, demonstrating a large number of high-quality signals. Trades were opened on the 5-minute chart only in the direction of the trend.
Strategy based on the RSI indicator at the broker Olympus Trade
For the best result and convenient operation of the strategy according to the RSI indicator, we advise you to choose the terminal of a trusted broker Olympus Trade – one of the most convenient and functional in trading.
The modern trading platform has the functionality necessary for comfortable trading: a personal account, convenient analytics, an expanded set of indicators for technical analysis on the main chart (MA, Parabolic SAR, MACD, RSI, Stochastic and Bollinger bands), the choice of expiration (from a minute to an hour), the ability to test strategies, use up-to-date market reviews and an economic calendar.
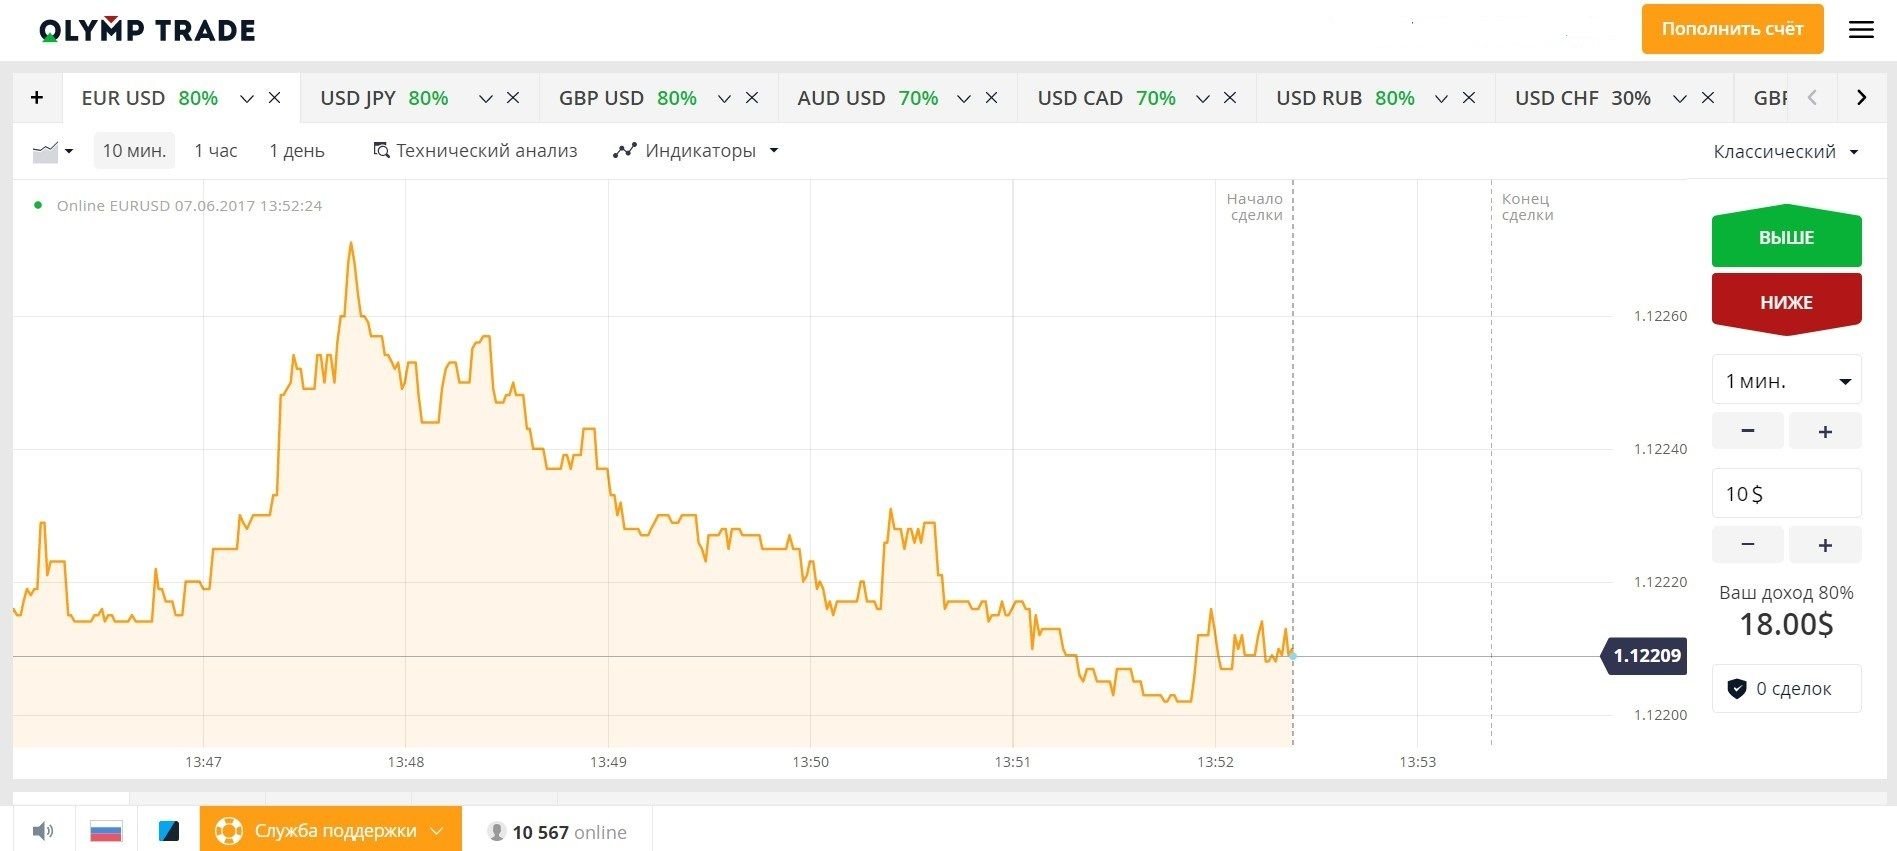
You can get acquainted with the current reviews about the broker Olympus Trade here. You can see what the terminal workspace looks like in the image below.
A detailed review of the Olymp Trade broker is here.
Go to the official website of the broker Olymp Trade here.
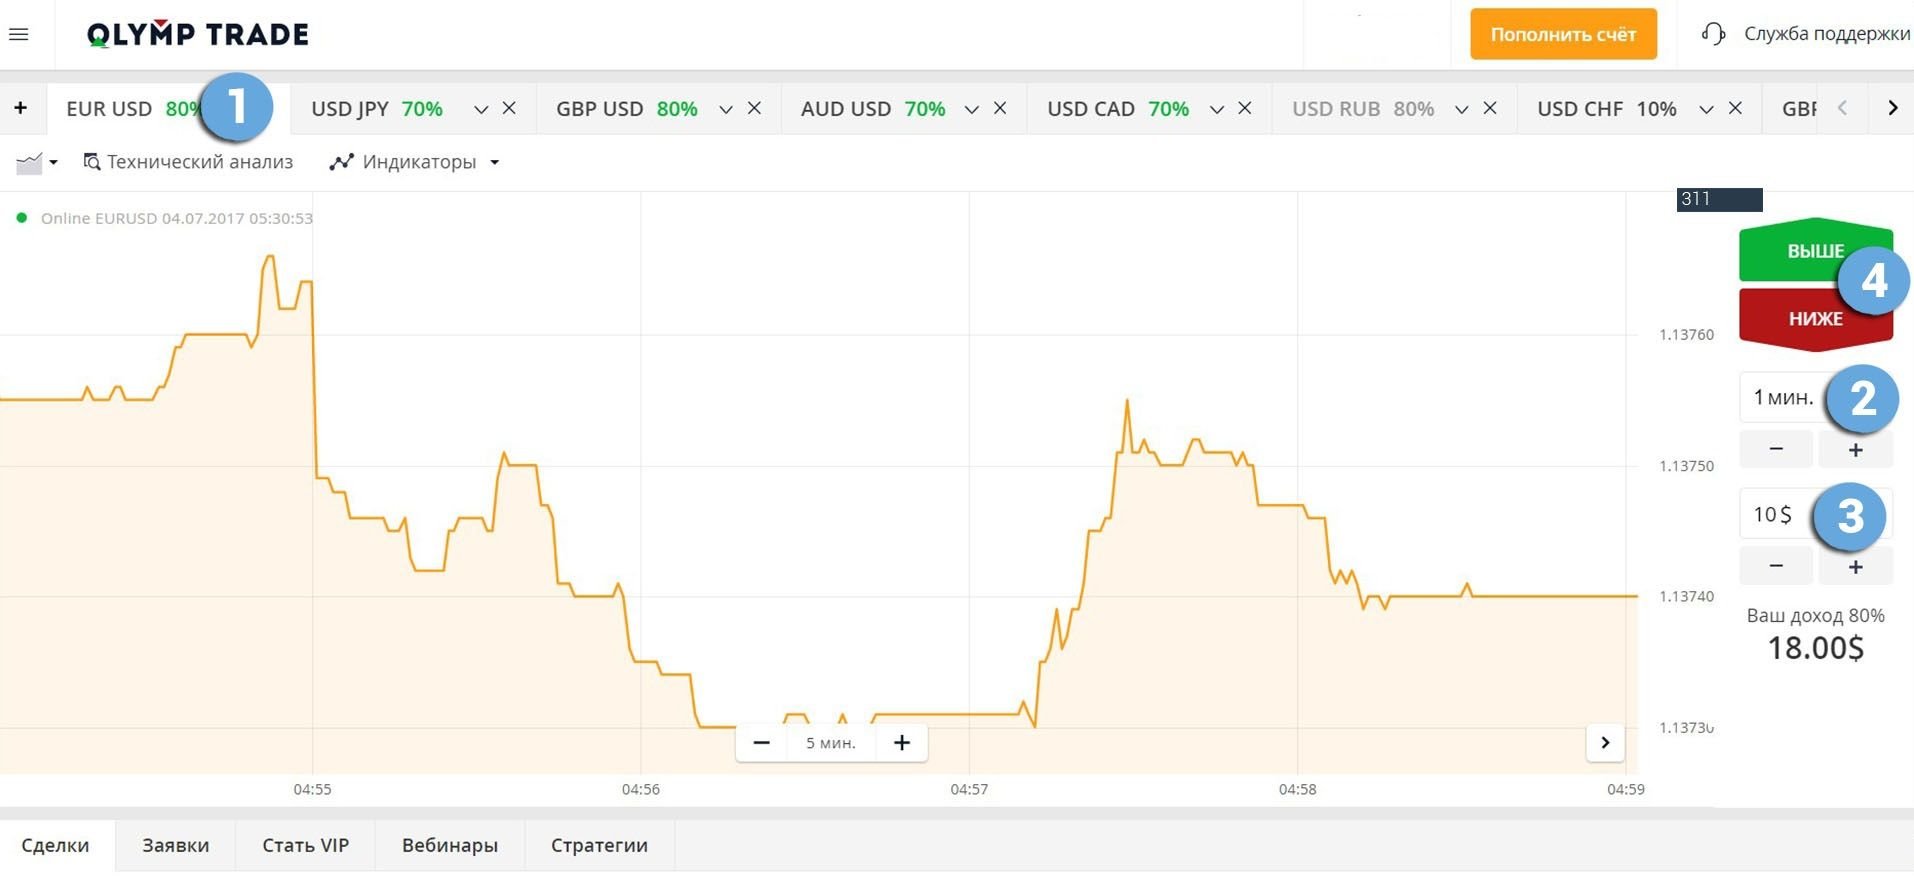
In order to buy a CALL option in the Olymp Trade trading terminal, follow these steps by going to the olymptrade.com website and preparing an option, indicating:
- Type of asset
- Expiration
- The size of the bet
- Forecast of quote movement: UP
- Click the “buy” button and follow the results.
In order to buy a PCI option in the Olymp Trade trading terminal, follow these steps by going to the olymptrade.com website and preparing the option, indicating:
- Type of asset
- Expiration
- The size of the bet
- Forecast of quote movement: DOWN
- Click the “buy” button and follow the results.
Try trading with Olympus Trade
Read reviews about Olympus Trade
Bonuses of the broker Olymp Trade
Working with Olymp Trade is especially profitable, the broker holds constant promotions and bonuses for customers. Such additional bonus funds expand opportunities and increase the chances of making good money without investing personal funds in trading.
Now the broker offers to take advantage of a profitable starting bonus for newcomers to the platform, which will double the bonus amount. The amount of the bonus depends on the amount deposited (according to the terms of the bonus funds).
Findings:
RSI is a reliable indicator that works. It is completely free, but simple and accessible even for a beginner of options. This oscillator is at the heart of many trading strategies, allowing you to make good profits while trading binary options.
Tagged with: RSI


