Good morning fellow traders. The third week of August begins. To make the day profitable, let’s analyze the indicator analysis of the main currency assets. Let’s start with an overview of the fundamental events that Monday has prepared for us.
Main news of the day
We check the economic calendar at the following time:
- USA: 3:30 p.m.; 23:00.
- New Zealand: 11:30 p.m.
- Switzerland: 10:15 a.m.
Do not forget that the release of news is one of the most unfavorable moments for entering a position. Pay special attention to the UK today.
Let’s move on to technical analysis.
Signals on EURUSD
Let’s analyze the indicator data on the four-hour (H4) timeframe.
- BB: The bands have a vaguely defined increasing slope, which can go into neutral at any time. This behavior of the indicator indicates the instability of the trend.
- MACD: the bars are located in the negative zone, which increases the probability of a downward momentum.
- RSI: the indicator line has come out of the overbought zone and has enough space for the downward correction to continue.
Possible pivot points
Support: 1.1145; 1.1151; 1,1158.
Resistance: 1.1164; 1.1171; 1.1177; 1,1184.
Recommendations: we enter sales from resistance points.

Signals on GBPUSD
Let’s analyze the data of indicators on H4.
- BB: a clear downward slope has been lost, so we should expect an upward correction in the near future.
- MACD: the bars are close to zero, which confirms the weakness of the downward momentum.
- RSI: the line has stopped decreasing and resumed growth.
Possible pivot points
Support: 1.2868; 1,2884; 1,2896.
Resistance: 1.2912; 1.2924; 1.2940; 1,2952.
Recommendations: we enter the purchase from support points.

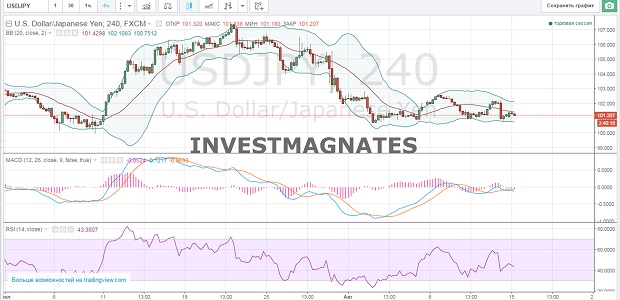
Signals for USDJPY
Let’s analyze the indicator data on the four-hour H4.
BB: the price is approaching the lower boundary of neutrally located Bollinger Bands. If no extraordinary events occur, an upward correction should be expected in the near future.
MACD: the bars are placed in the negative zone, but their size is gradually decreasing. This confirms the weakness of the downward momentum.
RSI: the line is decreasing, but approaching the oversold zone.
Possible pivot points
Support: 100.86; 101.00; 101,14.
Resistance: 101.28; 101.42; 101.56; 101,70.
Recommendations: we enter the purchase from support points.

Only a comprehensive connection of technical analysis, news and trusted binary options brokers can ensure success. Trade profitably and make more of the right decisions.
Good luck!
Tagged with: Binary Options Signals • Binary Options Signals • Binary Options Trading Signals


