Momentum Strategy
As an experienced trader, you are constantly looking for new tools that will help you achieve the maximum in options: you use proven indicators, profitable strategies, try to keep abreast of economic news. You know that finding new profitable solutions is important, it gives you the opportunity to achieve more and more new victories.
We present you a simple but effective options strategy, which is based on the
Momentum indicator
. Have you ever decided to invest in an industry, spent a lot of time researching it (based on fundamental and technical analysis), and you began to lose your resolve when it was necessary to place a bet? The Momentum options strategy will tell you what to do so that you do not have such obstacles.
Examples of the “Momentum” strategy
This strategy offers the trader examples of using the Momentum indicator with other tools, knowing about which, you can always create your own solid and profitable system for purchasing options:
- The Average Directional Index (ADX), which is in an uptrend;
- The Volume Volumes indicator, which is either on the rise or in the falling position;
- Moving averages. Signals of fast moving averages that intersect over slowly moving averages are needed.
By applying these indicators in practice, you will receive a clear signal to buy and sell options.
Starting your journey in trading, you work out the tools, create your own successful strategy, explore the concept of the market trend. The best market forces are those that concentrate on strategy and have the necessary patience in order to make the right decision and get a decent income.
Most successful traders use more than one oscillator in their work, because One indicator will not give confidence in making a decision to buy a particular option. Only entire trading systems and strategies allow you to assess the situation from several angles, and, removing all doubts, place a bet.
How does the Momentum strategy work?
Let’s demonstrate the operation of the above indicators when studying The Gap (NYSE: GPS) stocks.
Gap (GAP ) is an indicator of the difference between the closing price of the market on Friday and the opening price on Monday.
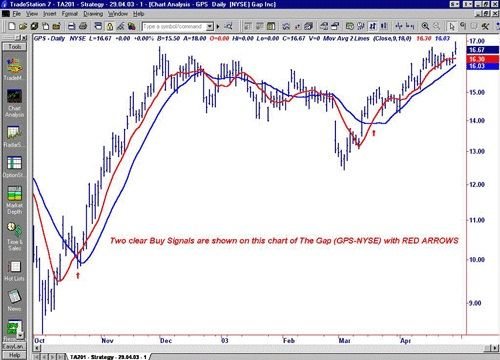
The first chart The Gap shows that the red arrows are placed on the most obvious buy signals, the first of which occurs on October 22, 2002, passing at the closing price of $9.99.
Further, in a few weeks, the stock closing price begins to rise to the level of $ 15.99, which indicates an increase of 62%. The second arrow occurs on March 18, 2003 at the closing price of $14.75, and on April 30, the closing price level is $16.67.
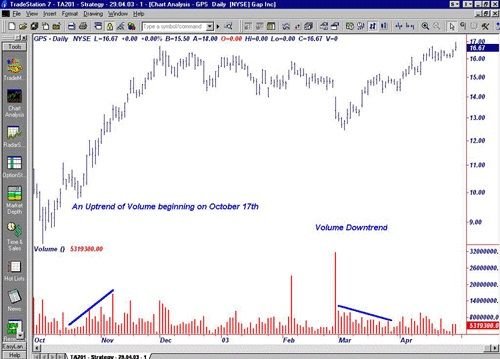
If you look at the second chart below, you will see a clear situation of an increase in the daily trading volume of the market, which has been taking place since October 17, 2002 (when 3,121,000 traded shares were presented on the market at the closing price of one share $ 10.52).
Further, the volume of the uptrend continued for several weeks, which by November 77 provided an increase to 16,261,000 traded shares at a closing price of $ 13.42. As you can see, our indicators record market volumes.
To see the market volumes more clearly, we use the capabilities of the ADX tool, as well as Moving Averages and Volumes. The advantage of the ADX (Average Directional Index) indicator is that it works ahead of the curve, showing the strength of the trend (i.e., whether the growth will continue or the trend will begin to slowly weaken), long before the price chart starts moving.
Thus, the upward trend coincides with the transition of double moving averages in the first chart. In this case, the importance of using more than one indicator in the strategy is shown very well: the stock price is growing on March 6, but the trend of decreasing volume has begun.
Traders using only the Volume indicator would not see the moment of the next increase in the stock price. Both indicators show two different situations, but which one should you trust? It is enough to use the third indicator of the Momentum strategy to avoid confusion.
A simple but understandable explanation for the ADX data is that this oscillator is able to measure the strength of the prevailing trend and determine if there is a movement in the market at the moment. The indicator is measured on a scale from 0 to 100:
- Low ADX readings (less than level 20) indicate the existence of a non-trending market with low volumes.
- Finding the instrument above point 20 indicates the beginning of a trend (which will continue up or down).
- When the ADX is above the 40 mark and falls, this indicates a slowdown in the trend.
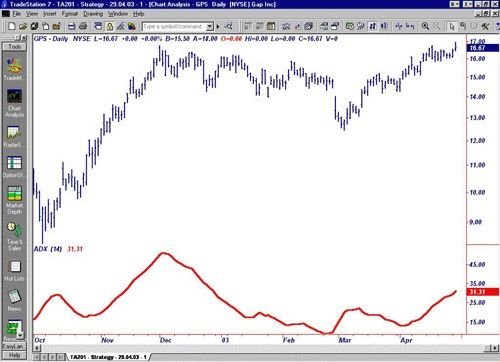
The indicator can be used to find non-trending markets or confirm the situation of a deterioration in a constant trend. The ADX readings in The Gap chart indicate a certain strength of the trend, which falls at the end of October. On November 1, the level of the ADX line reaches 20.03. Moving averages first show a buy signal.
Around the same time, there is an increase in volume, the ADX reading graph rises above the 20 mark. At such moments, traders should pay attention to stocks:
Confusion about whether the buy signal was clear continues in March of this year. On the day when the double moving averages show a clear buy signal, the ADX oscillator, on the contrary, falls to 18.64, then crossing above the level of 20 in the previous week. Thus, the downward trend of volume is shown and the ADX confirms the trend of destruction.
Strategy “Momentum in your favor” at the broker FiNMAX
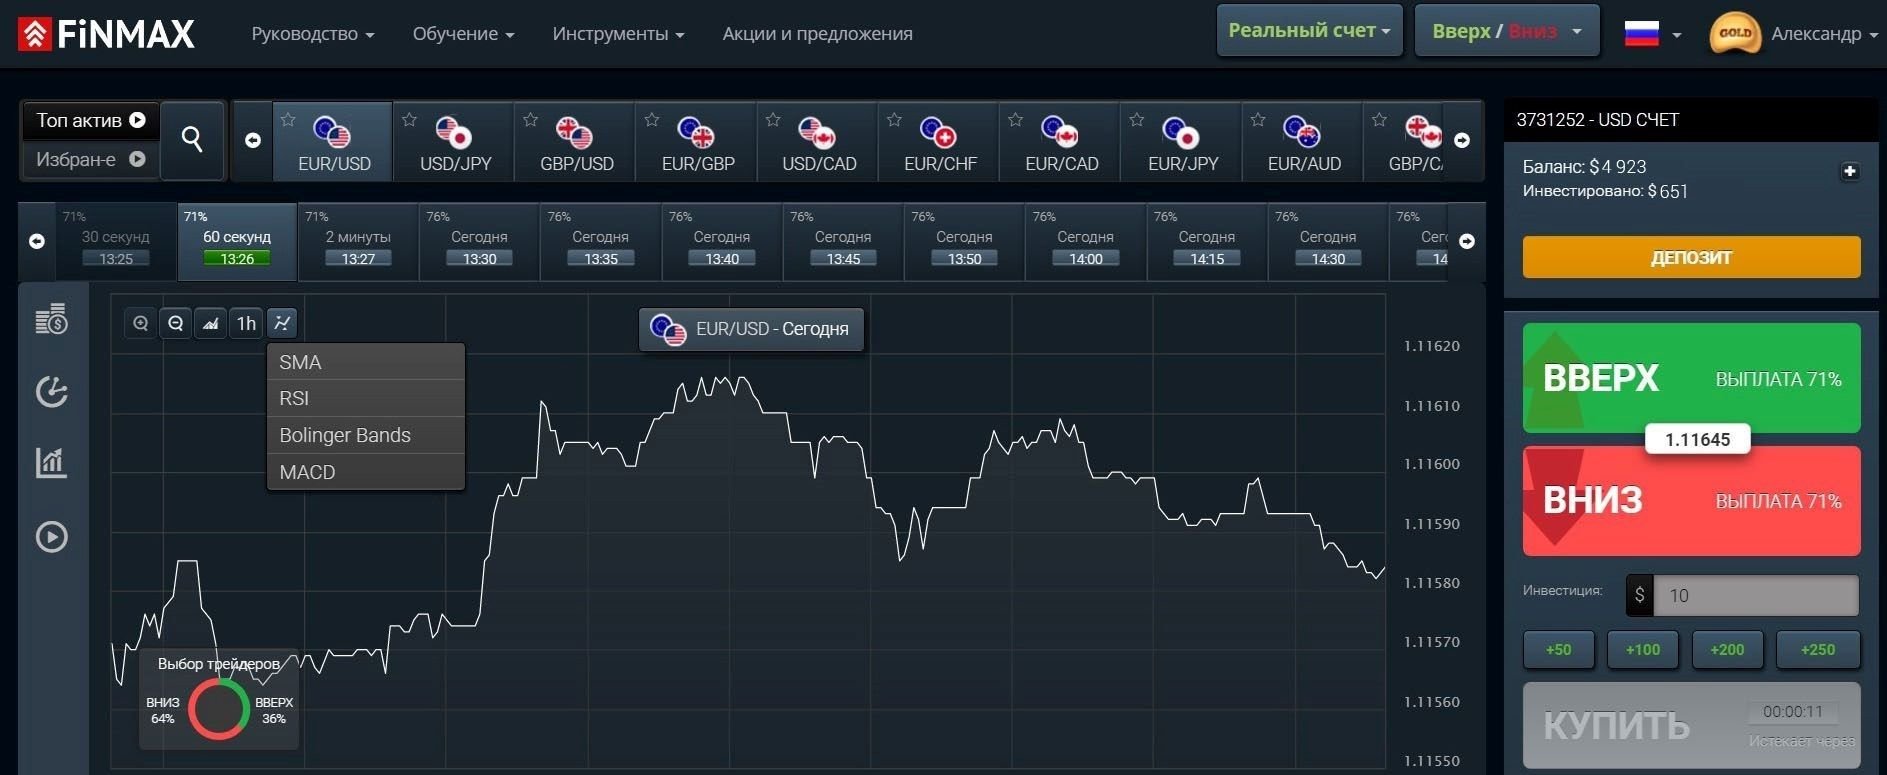
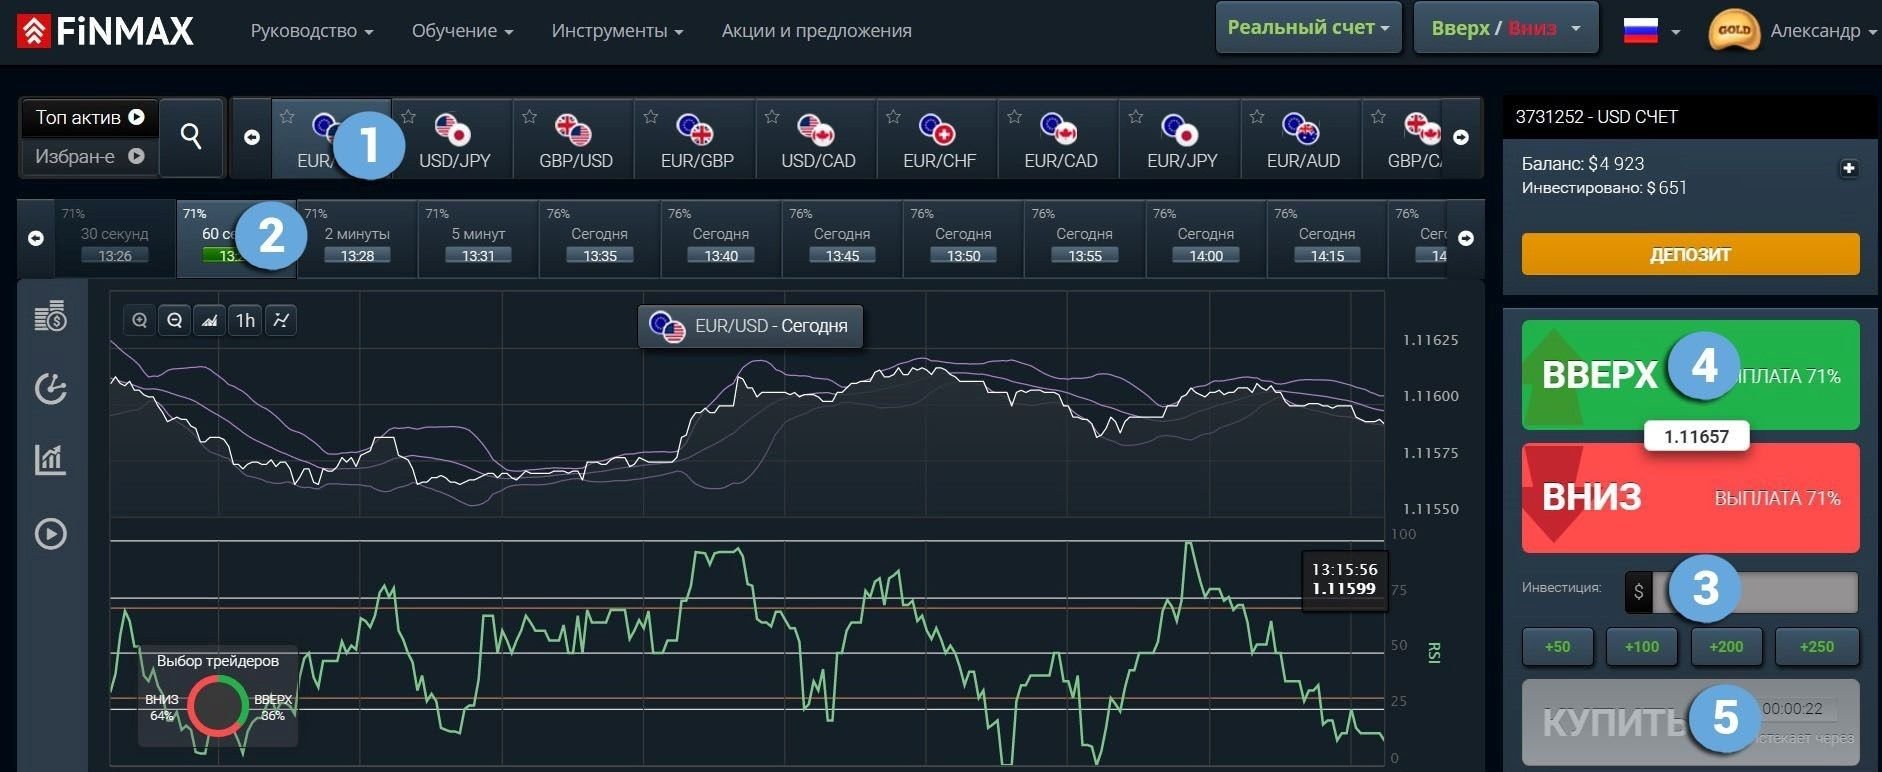
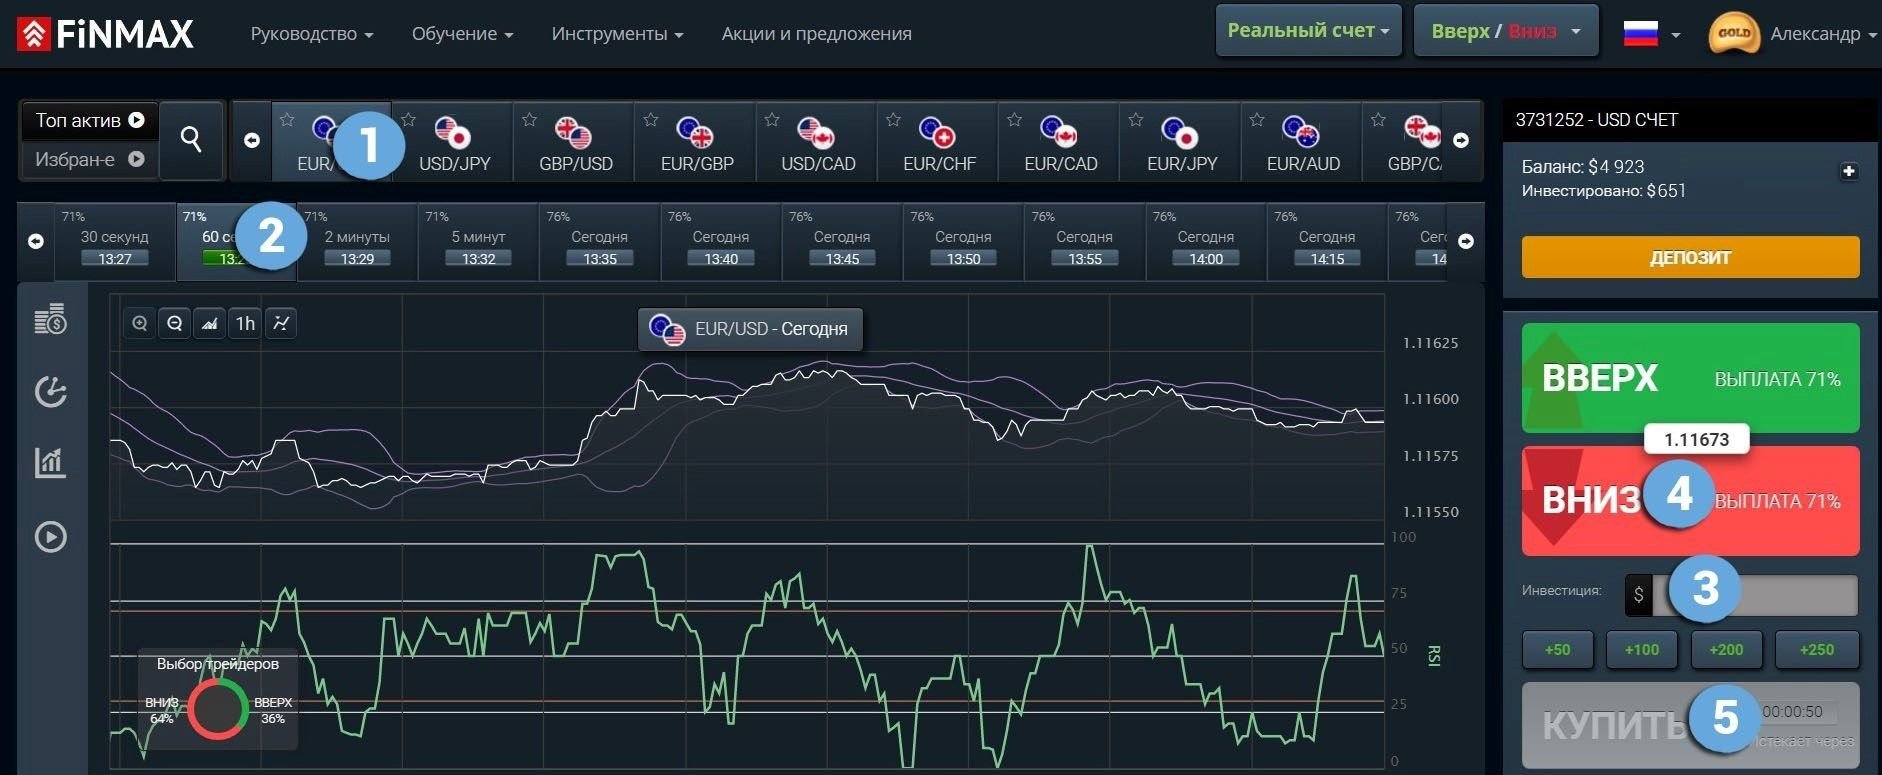
We recommend trading using the “Momentum in your favor” strategy in the terminal of a reliable broker FiNMAX, which will make the work most comfortable. The functional platform is distinguished by advanced features (convenient choice of expiration from 30 seconds to six months, a set of indicators, types of charts, analytics, personal account, transaction history, training materials) for trading. You can see what the terminal workspace looks like in the image below. Explore the broker’s capabilities by going to the finmaxbo.com website.
A detailed review of the FiNMAX broker is here.
Go to the official website of the FiNMAX broker here.
In order to buy a
CALL
option in the Finmax trading terminal, follow these steps by going to the finmaxbo.com website and preparing the option, indicating:
- Type of asset
- Expiration
- The size of the bet
- Forecast of quote movement: UP
- Click the “buy” button and follow the results.
In order to buy a
PCI
option in the Finmax trading terminal, follow these steps by going to the finmaxbo.com website and preparing the option, indicating:
- Type of asset
- Expiration
- The size of the bet
- Forecast of quote movement: DOWN
- Click the “buy” button and follow the results.
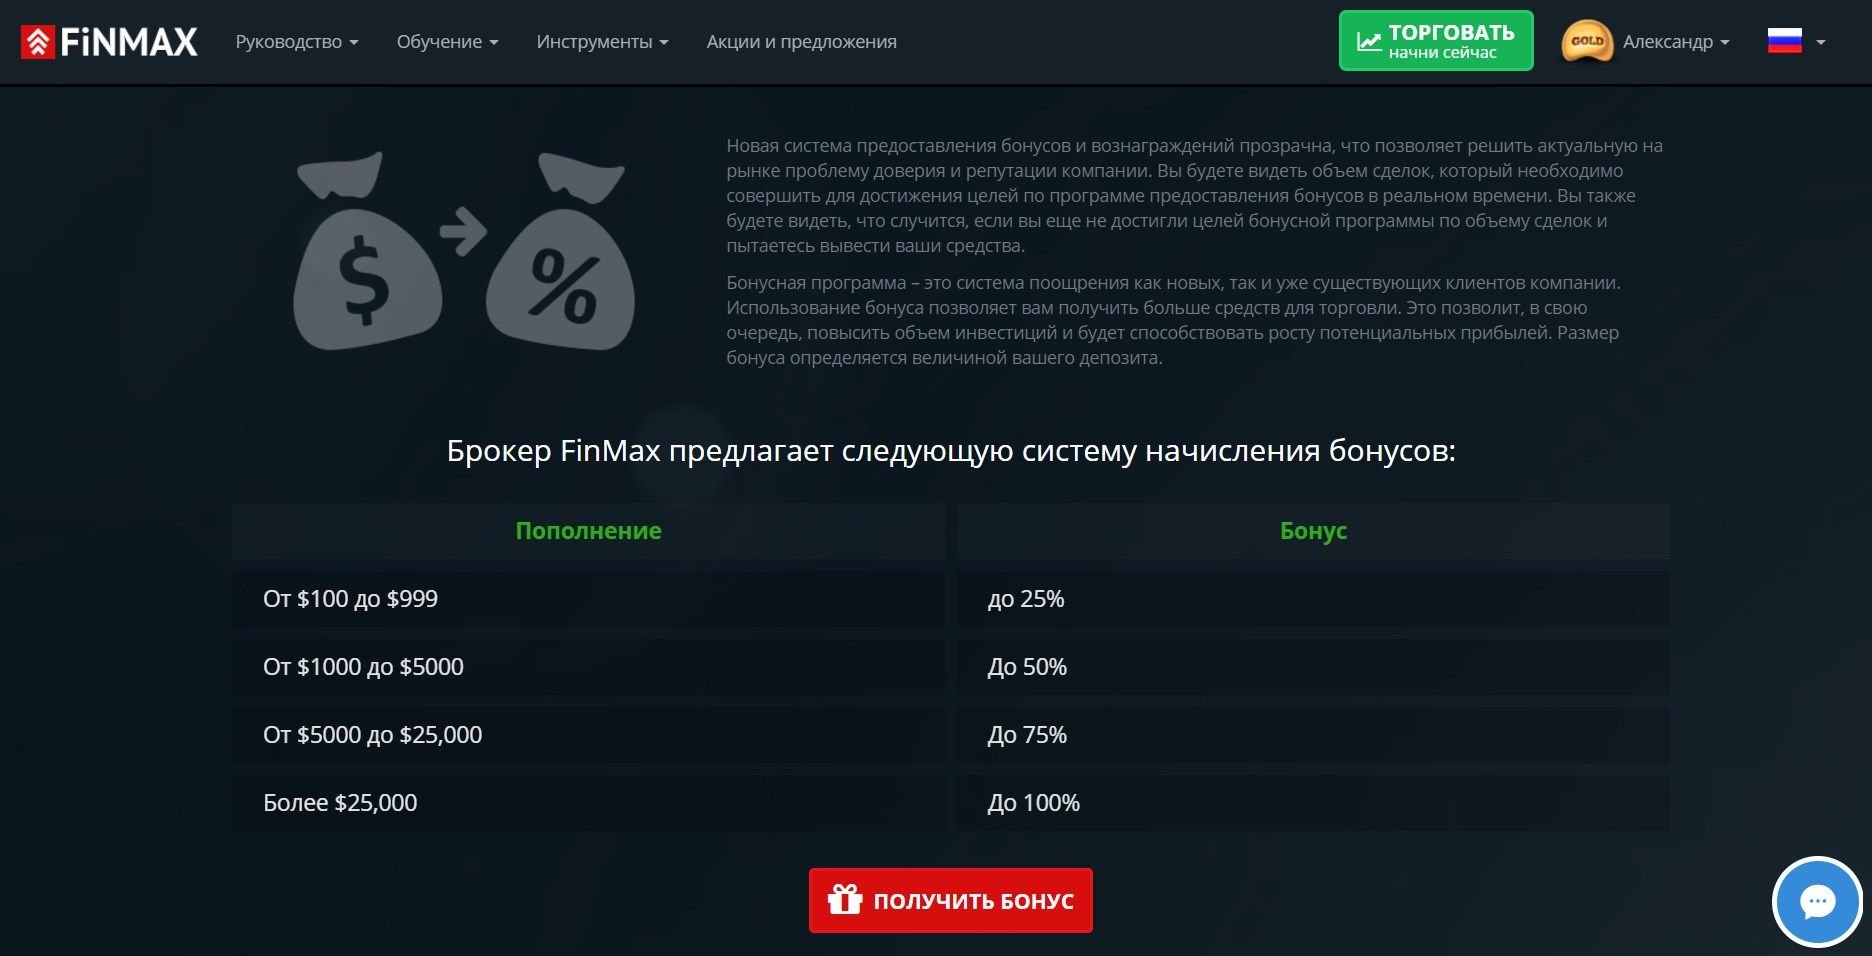
FiNMAX broker bonuses up to 100%
The official FiNMAX website offers many lucrative promotions and special offers to its users, which you can get acquainted with here. Promotions and bonuses make binary options trading with a broker much more effective.
Tournament on a demo account from FiNMAX
Free tournaments of the official FiNMAX website are held for those traders who have a demo account on the broker’s platform. The tournament is organized in order to support talented market players, giving them the opportunity to receive prize money for further trading without replenishing the deposit. So, the broker makes trading possible without personal investment. The main condition for participation in the tournament is the availability of a demo account. Both options beginners and professionals can participate in the event.
Take part in the FiNMAX tournament
Findings
“Momentum” is a reliable strategy that will help determine the exact time of the best market entry situation. Carefully working on this trading system and using the proposed indicators, you will be able to increase your income several times.
Tagged with: Binary Options Strategy

