When it comes to trading, there are a huge number of binary options indicators at your disposal. There are so many of them that many traders often get confused when it comes to binary options indicators, and which of them should be used in which case, and also do not understand what each individual indicator indicates. And it is the lack of this information that causes traders to use the wrong indicators when it comes to trading.
And although all indicators were originally created for the Forex market and stock markets, they can easily be used for trading binary options. If you still feel not confident enough about which indicator to use, then we advise you to read this article, with the help of which you can understand correctly what binary options indicators are. At the end of reading this article, the reader will receive a fairly accurate understanding of what various indicators for trading binary options are.
What are indicators for binary options trading?
Binary options indicators are nothing more than mathematical values collected in a chart. The formulas that are used to derive these values are based on prices. And the price, as we know, has four different levels. Open (opening price), closed (closing price), low high; often all of this is referred to briefly as OHLC. Based on these four values, indicators are displayed.
As you may have already begun to understand, all indicators are derived from prices and there is nothing magical about using these indicators.
Types of indicators for binary options
There are different types of binary options indicator, and every indicator you come across will fall into one of the following groups.
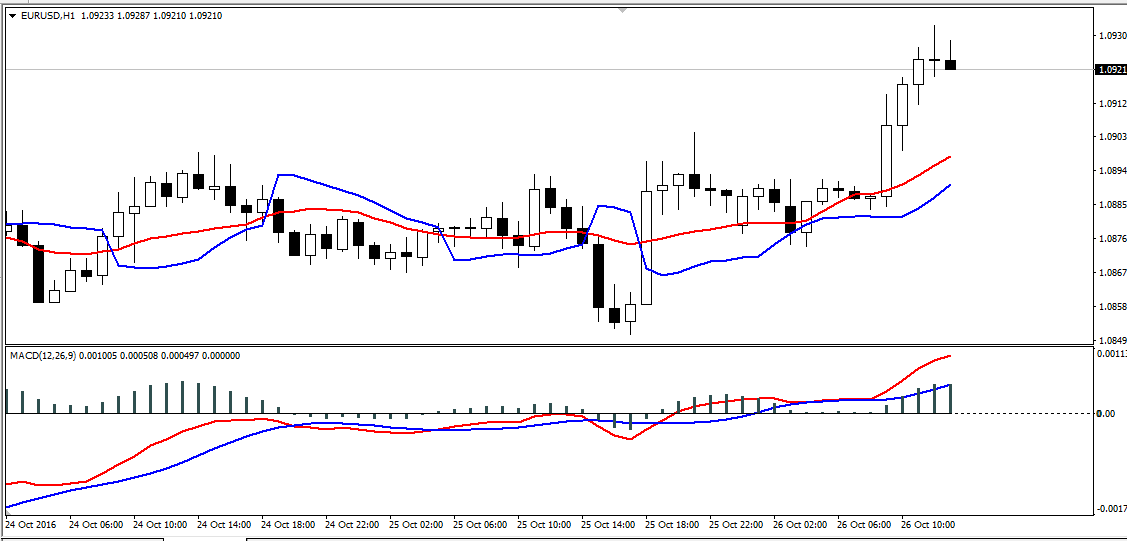
Trend indicators: usually compiled in the form of a chart and are based on price. The most famous example of a trend is the moving average. What is a moving average? Nothing more than the average value of the price collected in the chart. The main indicator of the trend indicator is that when the in-line price is above or below the average price, then the in-line price is defined as one that moves down or up the trend.
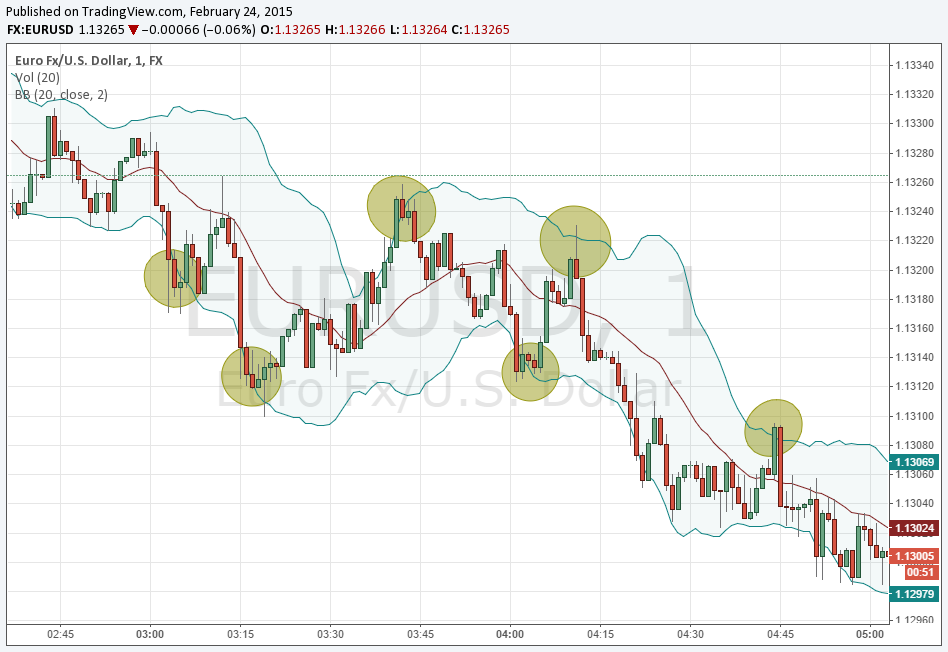
Volatility indicators: usually based on low and high, and in some cases, on the opening and closing prices. Indicators based on the volatility of binary options are collected in a chart and superimposed on the price. The most well-known examples of a volatility indicator are the Bolinger Bands. Other similar indicators are, as a rule, indicators based on envelopes or bands, collected in a chart.
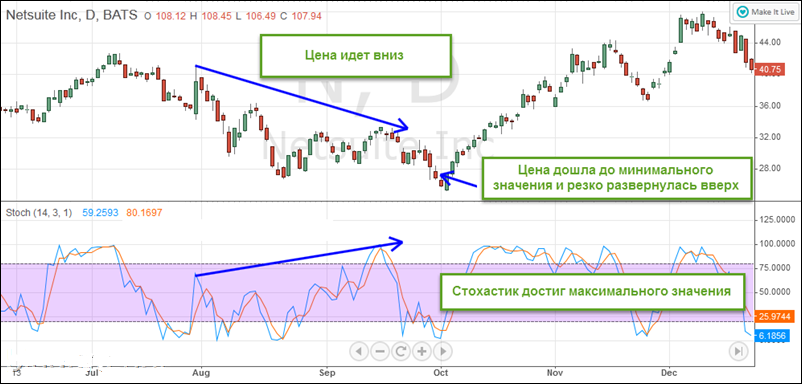
Oscillators: These are those indicators that oscillate between fixed levels. They are usually indicated in a separate window and indicate an oversold or overbought state in the market. In other words, oscillators are calculated by price, and can be located at any point in the four price values. The most popular oscillators are the MACD or Stochastic oscillators.
Cyclical indicators: are a bit complex, they indicate cycles, peaks, breakouts, falls or corrections in price. Cyclical oscillators look similar to oscillators, so people confuse them, and use them as indicators of oversold or overbought in the market. Cyclical indicators should be used to determine the beginning and end of a correction. The well-known cyclical indicator is the Schaff Trend.
All indicators for binary options
When Are Binary Options Indicators Used?
The market does not move in a straight line. It is often said that the trend in the market takes only 20%, about the remaining 80% – for movements. Thus, it does not make sense to use the appropriate indicator.
When the market is trending, then trend indicators are definitely the best choice. For example, the moving average indicator is the best indicator to use because it reflects the in-line price in relation to the average price.
Similarly, when the market moves sideways, then using an oscillator that indicates overbought and oversold is the ideal of the entire set of indicators.
But what if you don’t know which binary options indicator you should use?
This is where many traders make mistakes. The easiest way to eliminate this confusion is to use those indicators that are not redundant. For example, most traders use the RSI together with Stochastic. There is no need for this, as they are the same things, perhaps different in the way of calculations. In the same way, the use of a moving average along with an envelope is redundant. Most of the volatility-based envelopes or indicators combine both trends and indicate volatility.
Thus, traders always use two or more indicators (usually a trend indicator and an oscillator), so that both indicators can assist traders in identifying the trend and sideways and changing market directions.
With the above information in mind, let’s move on to the next step and identify the top 5 binary options trading indicators and how they can be used to build a strong and reliable binary options trading strategy.
Five Best Indicators for Binary Options
All binary options indicators can be divided into the following types. Thus, it is important to understand the types of indicators rather than focus on the many endless indicators that promise you untold riches.
1. Moving Average: This is arguably the best trend indicator available. It is a flexible indicator that allows traders to perform many modifications, such as setting the period to closed or open, high or low, as well as changing the period, and should not forget such moving averages as simple exponential, linear weights, aligned. You will use the moving average indicator to trade binary options, and primarily to calculate the trend in prices. If the price is higher than the moving average, then this indicates that the price is going up, or vice versa. It should also be taken into account on the slope of the moving average, as this is a signal of a strong trend.
Strategies for binary options based on the Moving Average indicator:
- “3 moving averages”
- “Moving average” is a simple strategy
- “Two moving averages”
- “Trim”
- “Gliding on the average”
2. Bollinger Bands: More diverse, as they can contract and expand depending on market volatility. You’ll use Bollinger bands to identify fractures or to trade in high momentum markets, for example, before a major news release, Bollinger bands will tend to shrink to indicate that a volatile movement is approaching in the market. The average Bollinger band is a moving average, so the indicator gives you two-in-one: trend and volatility.
Strategies for binary options based on the Bollinger Bands indicator:
3. Stochastic Oscillator: A wonderful indicator to use, especially if you notice that prices are moving within the spectrum. In addition to using Stochastic simply to trade sideways price fluctuations, it can also be used to identify corrections within a trend by simply following the trend of the oscillator moving as it crosses above or below the 80 and 20 levels. Ideally, the oscillator should be used in place with a trend or volatility indicator.
Strategies for binary options based on the Stochastic oscillator:
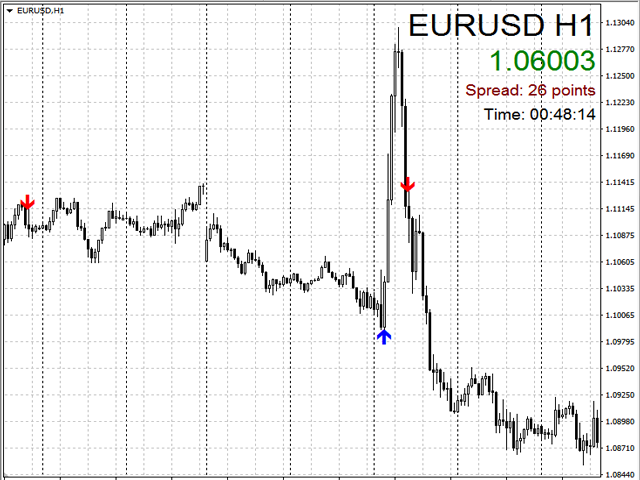
4. Turning Points: A trading instrument that technically falls under the category of Turning Point Indicators; They are usually calculated and give 7 price levels based on high/low/open and close the previous day. The middle line is marked as a turning point, followed by three resistance lines, above the turning point, and 3 base lines, below the turning point. When the price reaches an extreme support level or resistance, denoted by the terms S3 or R3, it indicates either a long trend or a reversal. Conversely, if the price fails to reach the first support or resistance level, this indicates a potential trend reversal.
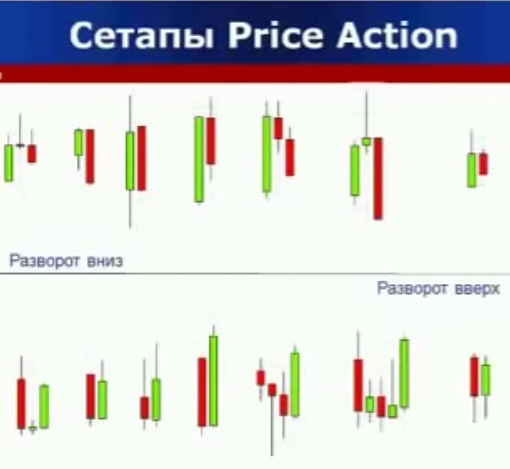
5. Price Action: Most likely the most obscure trading concept, and it is the most confused. It is not an indicator, but it is an important tool for binary options traders and ordinary traders. Price action combines the use of candlesticks, support, resistance, and chart charts. It’s usually not exactly suitable for beginners, but understanding what it is will be an important asset in your success as a trailer. The effect of the price differs from various teachings and studies, since it takes a huge amount of time and practice to study it. Another advantage of studying price action is that it complements any trading strategy built on indicators.
Binary Options Indicators: Build Your Strategy!
Now that you have a better understanding of what different trading indicators are and how to use them in binary options, we can start building our own binary options strategy. And this article will help you with this, which will allow you to use the various indicators that were described in this article. By correctly identifying the indicator you are using, you can combine their different types and build a strong and reliable binary options strategy.
Remember that if the indicator does not give you the results you want, then either you are using the wrong indicator or you need to change its settings. The most important thing when using binary options indicators is that you need to constantly monitor, adjust, test your trading strategies in order to find the best settings that you will use in binary options.
Inference
When it comes to trading, there are a lot of indicators, so many that traders often get confused about which indicator to use, and it all ends with the fact that they simply do not understand what which indicator means. Lack of information leads to the fact that most trailers use the wrong combinations of indicators when it comes to trading.
And although the indicators were originally built for Forex or stock markets, they can easily be used for binary options. If you are confused about which indicator to use, read this article, with the help of which you will be able to understand correctly what binary options indicators are. At the end of reading this article, the reader will receive a fairly accurate understanding of what various indicators for trading binary options are.
Tagged with: Binary Options Indicator

