Momentum Oscillator Indicator
Description
As we promised, we continue the cycle of detailed reviews of binary options oscillators for users of our portal. As you know, in financial trading, success will accompany those who are constantly learning, observing the picture of the market, and knowing about trends. Therefore, both beginners and professional traders are constantly improving, learning new strategies, connecting new tools for effective work. Ultimately, it is this approach that will give confidence during trading and stability in earnings.
Today we will talk about one of the most interesting technical indicators – the Momentum oscillator, you will get acquainted with its features, learn how to effectively apply it in practice. You can also see a review of the Momentum indicator for the forex market: https://eto-razvod.ru/forex-indicators/momentum/. The Momentum Oscillator – or also the Tempo Indicator (Momentum Indicator), is one of the simplest and most understandable technical indicators that measures the magnitude of price change over a specific period. The advantage of the Tempo Indicator is that it identifies emerging trends, determines the exact entry points into the trend, while acting ahead of the main price chart.
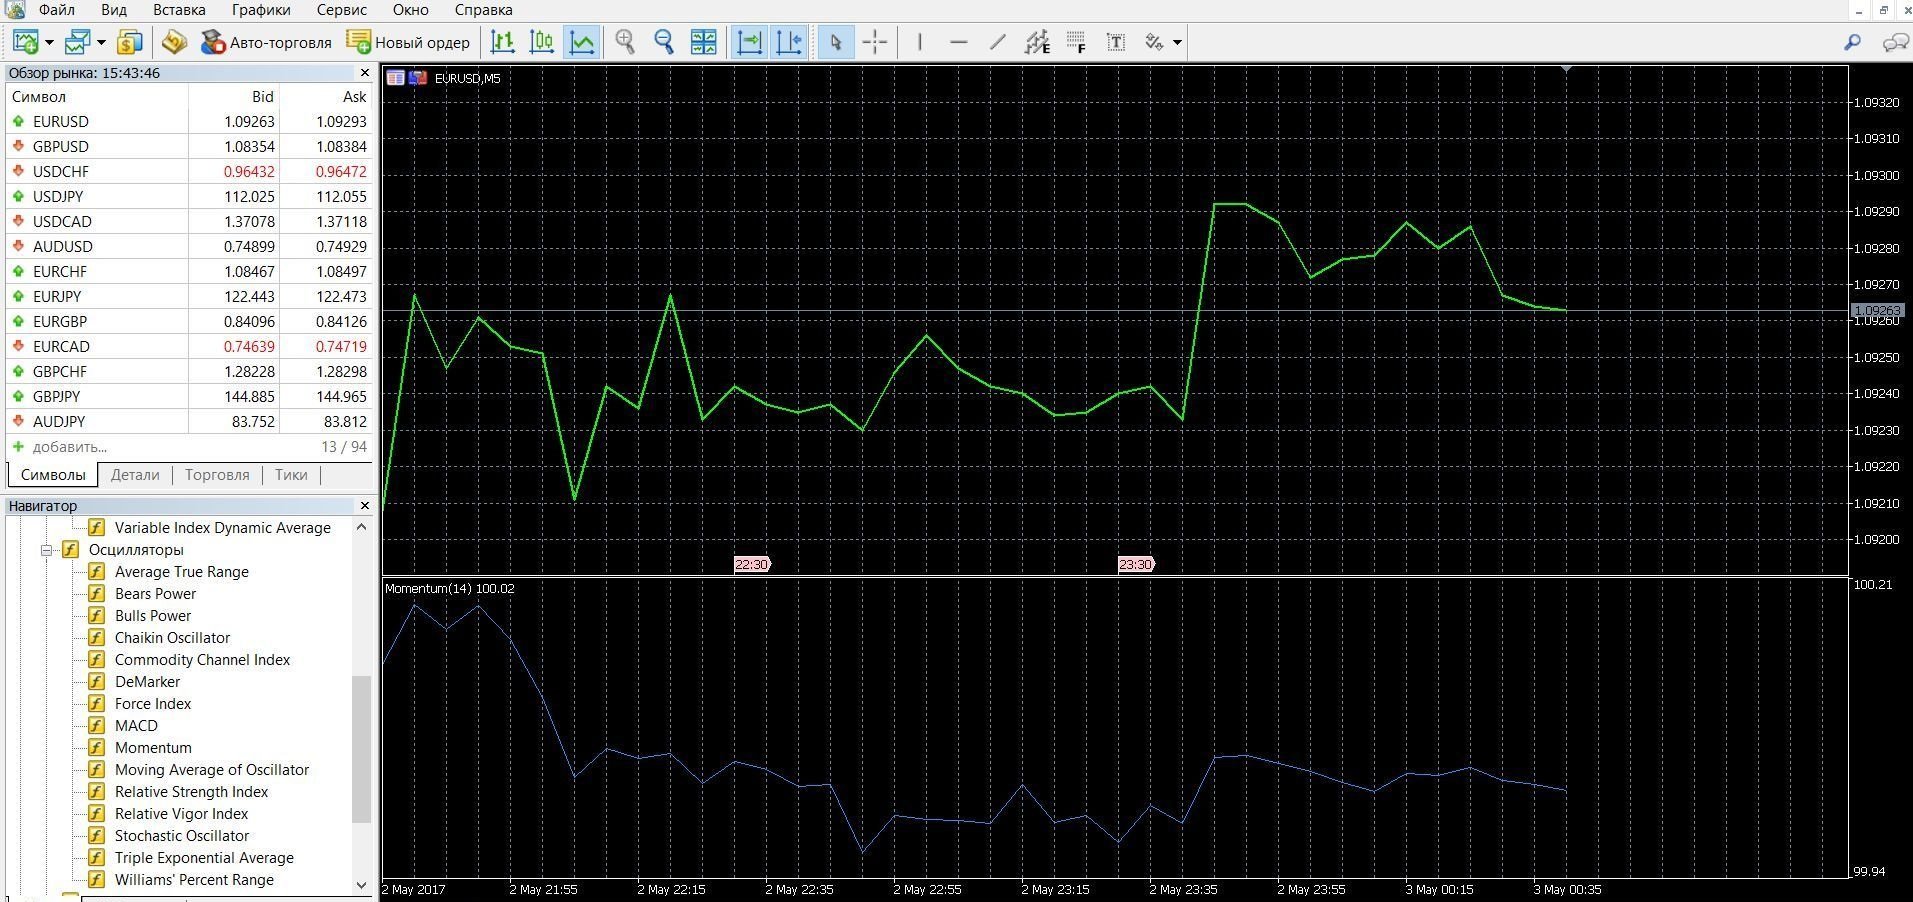
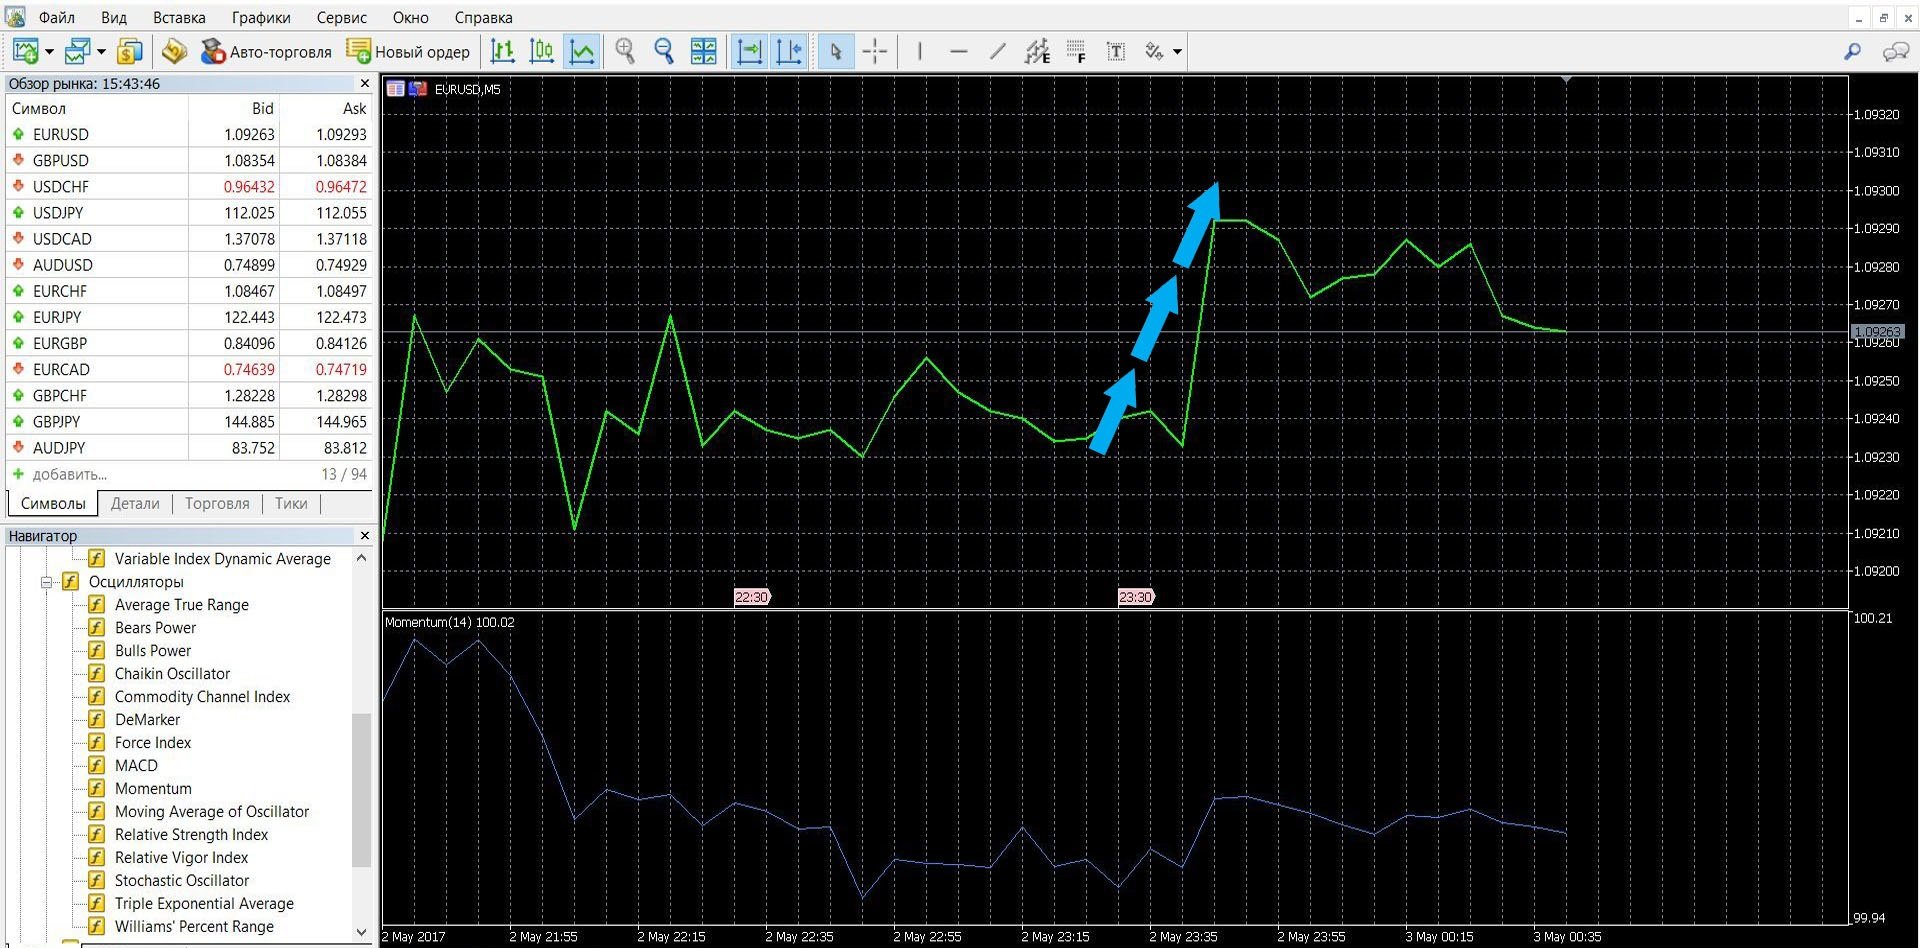
Based on the readings of Momentum, we can assume what the price dynamics will be, react to its changes as early as possible and make the right bet. It is curious that it is not known who owns the authorship of the creation of this tool. The main popularizer of the oscillator is considered to be trader Martin Pring. This effective, reliable tool is easy to use and suitable for both beginners in trading and professionals with extensive experience in trading. It is more effective to use it in long-term trading, but you can also use the tempo indicator on short timeframes. You can see how the Momentum oscillator looks on the MetaTrader 4 (MT4) platform in the image below. You can also download the MetaTrader 4 platform and work with this indicator.
What is the principle of operation of the Momentum oscillator
Momentum is translated from English as “momentum”, that is, the strength and magnitude of the price movement for a specific time. The principle of operation of the indicator is based on a comparison of price fluctuations, the oscillator shows the differences between the price of the current and the initial value. On the charts of the MetaTrader 4 trading platform, the indicator is depicted as one curved line below the price chart. To get accurate data, it is worth using an oscillator when its line moves simultaneously with the trend in the same direction.
If you have good experience in trading, it is recommended to use the Momentum indicator in trading against the trend in order to work with overbought-oversold zones. The Momentum indicator will allow you to get correct trading signals that even a beginner in trading can easily interpret. In binary options trading, the Momentum indicator can be used both as an oscillator and as a trend indicator:
- If you work with it as an oscillator, then in this case the buy signal is the beginning of growth after the maximum of the fall, the sell signal is when the curve begins to fall after the maximum rise.
- If you work with it as a trend indicator, then in this case the signal is the crossing of the zero line: buy – rise from below, sell – fall from above.
The oscillator is also used to work with a divergence signal:
- If the main price chart shows a new high above the previous one, and in Momentum the new high is lower than the previous one, this indicates that an upward downward movement will begin soon.
- If the main price chart shows a new low below the previous one, and in Momentum a new low is higher than the previous one, this signals that a downward movement will begin soon.
You can use the Momentum oscillator on all timeframes, but it is effective to use its capabilities in long-term transactions. And although in practice the oscillator signals are more often accurate, it is worth using other indicators for the reliability of decision-making.
The formula for calculating Momentum is:
Momentum Simple = C – C-n, where
- C is the closing price of the current period.
- C-n – closing price of N periods ago.
Info taken from enc.fxeuroclub.ru website
Do I need to install the Momentum indicator in your platform?
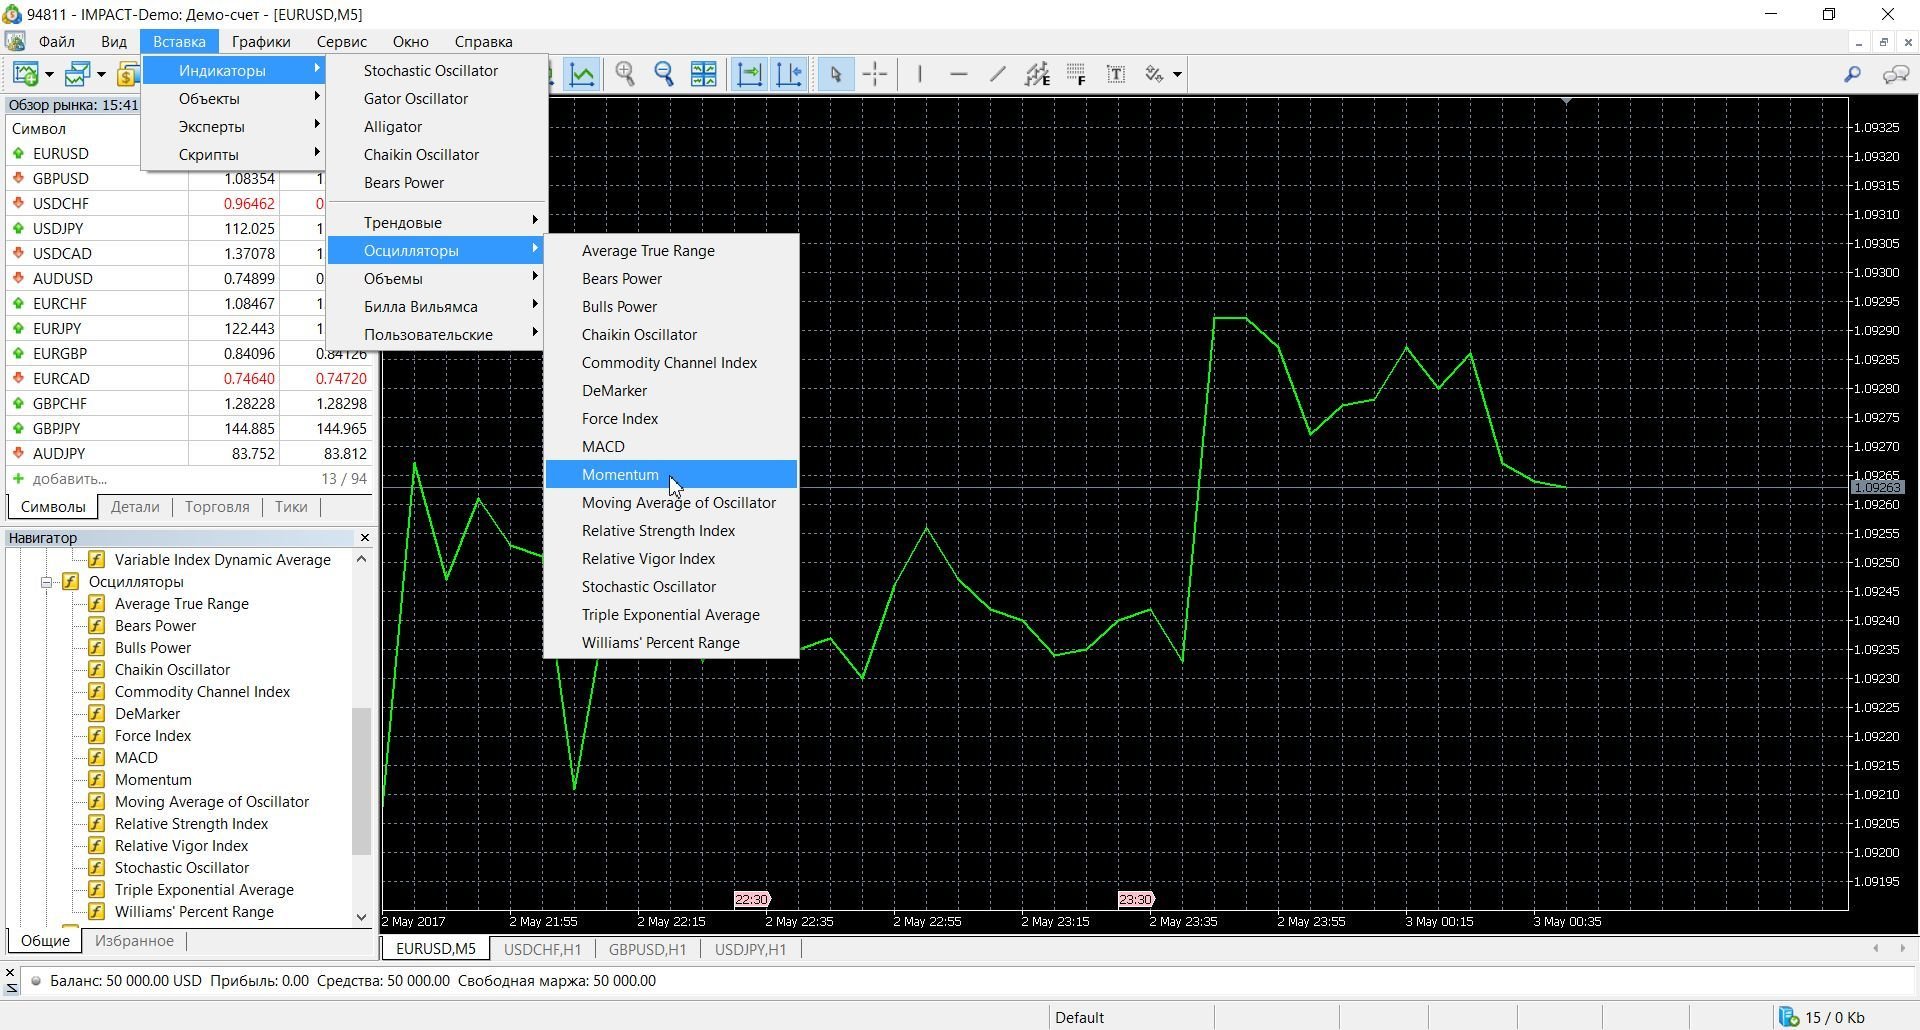
The Momentum Oscillator is represented in almost all trading platforms, it is also available in the list of oscillators of the MetaTrader 4 platform. To add an indicator to the price chart on the MetaTrader 4 platform, follow these steps:
- Click the “Insert” tab in the top menu of the platform
- Select the “Indicators” tab
- In the drop-down menu that opens, select the “Oscillators” tab
- In the drop-down menu that opens, select Momentum
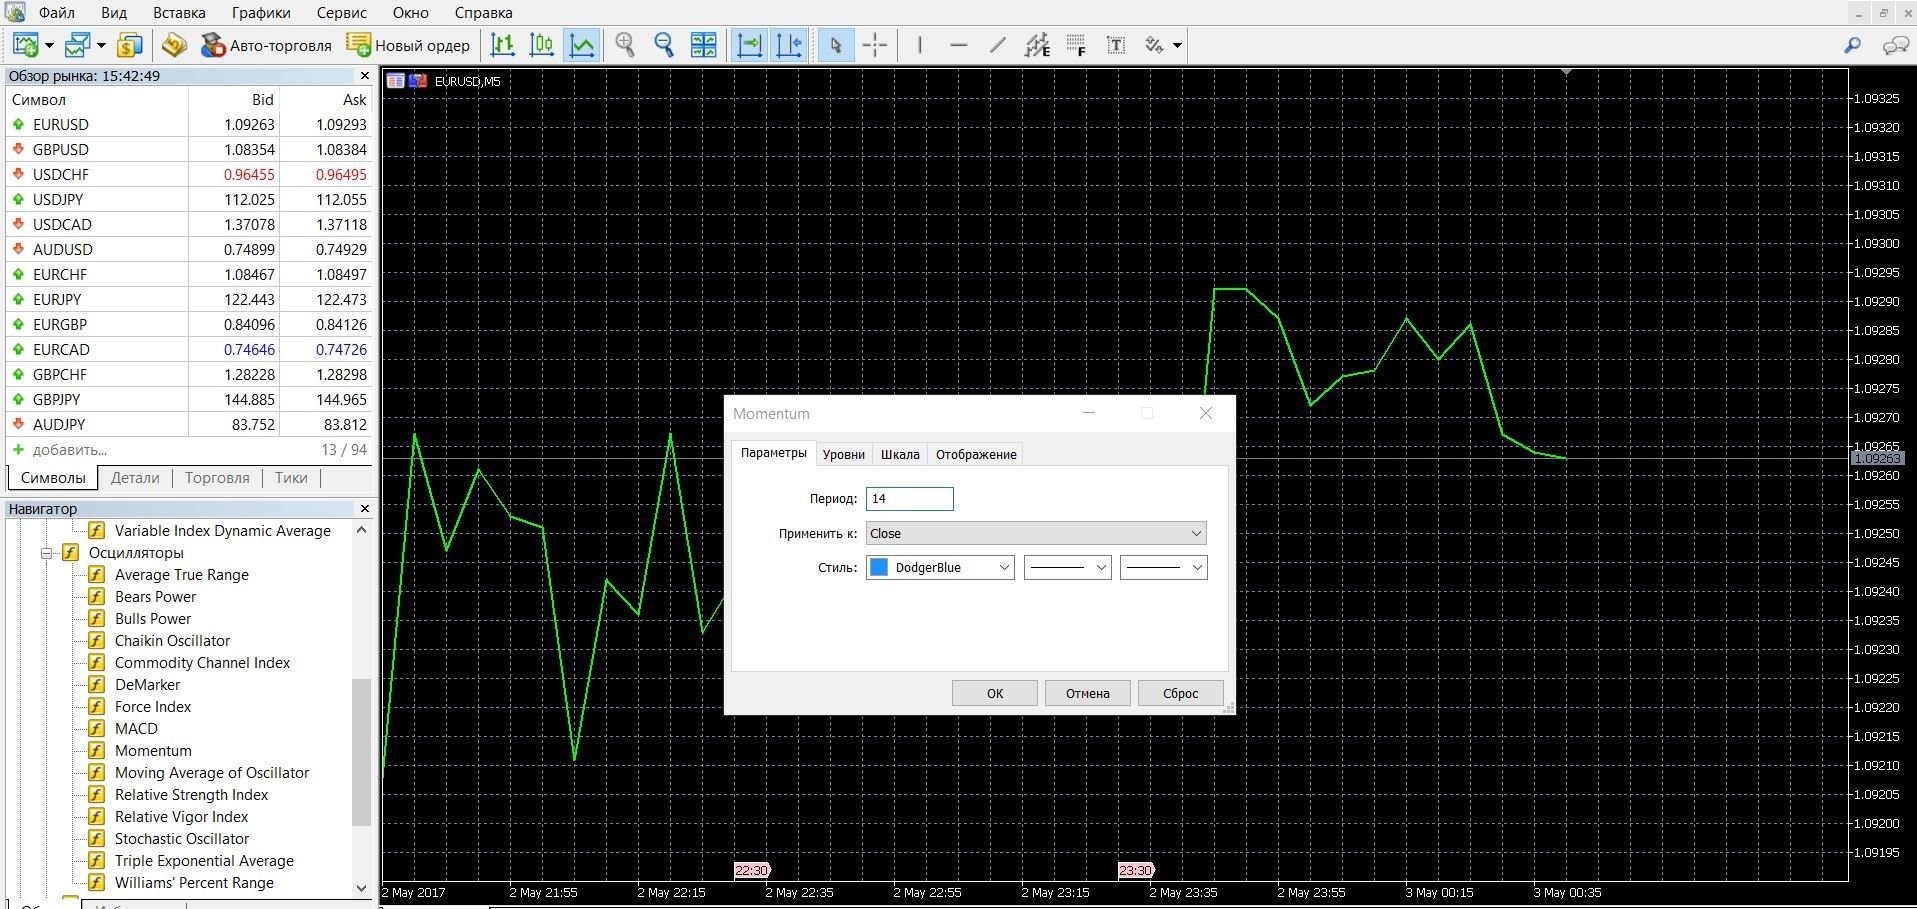
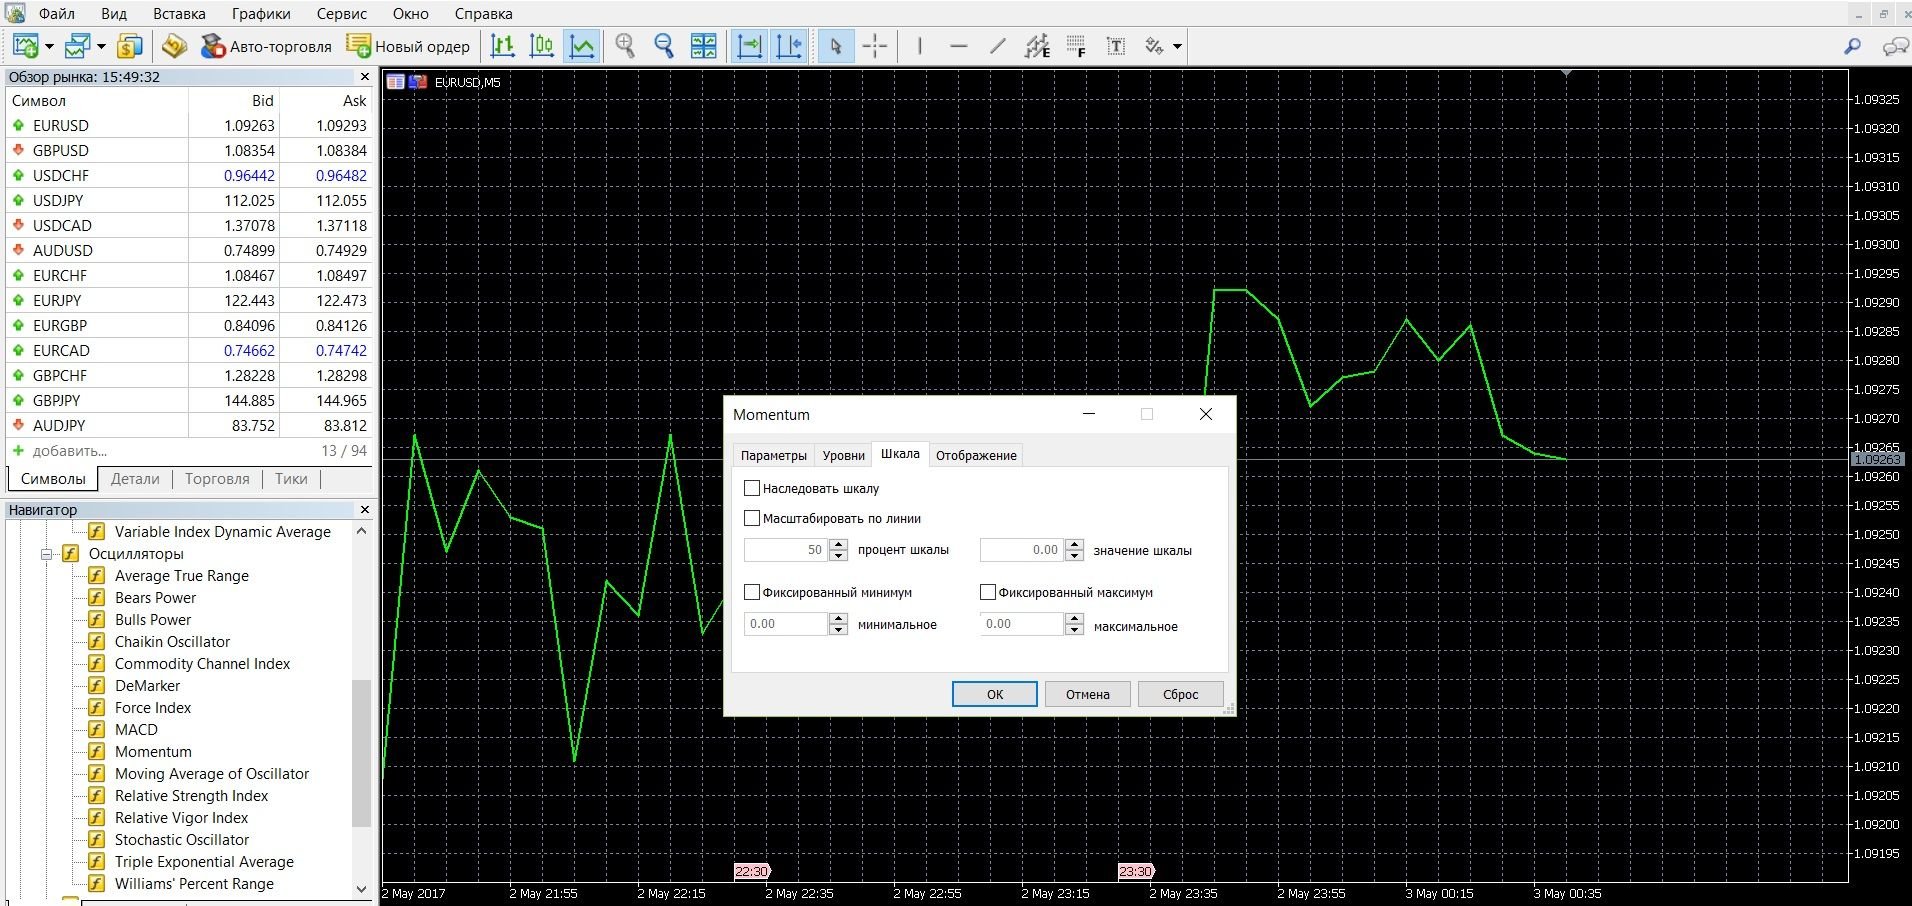
- When you add a Momentum to the chart, an active window will open in which you can change the parameters.
- So, the graphs are formed, you can work with the material.
Momentum indicator settings
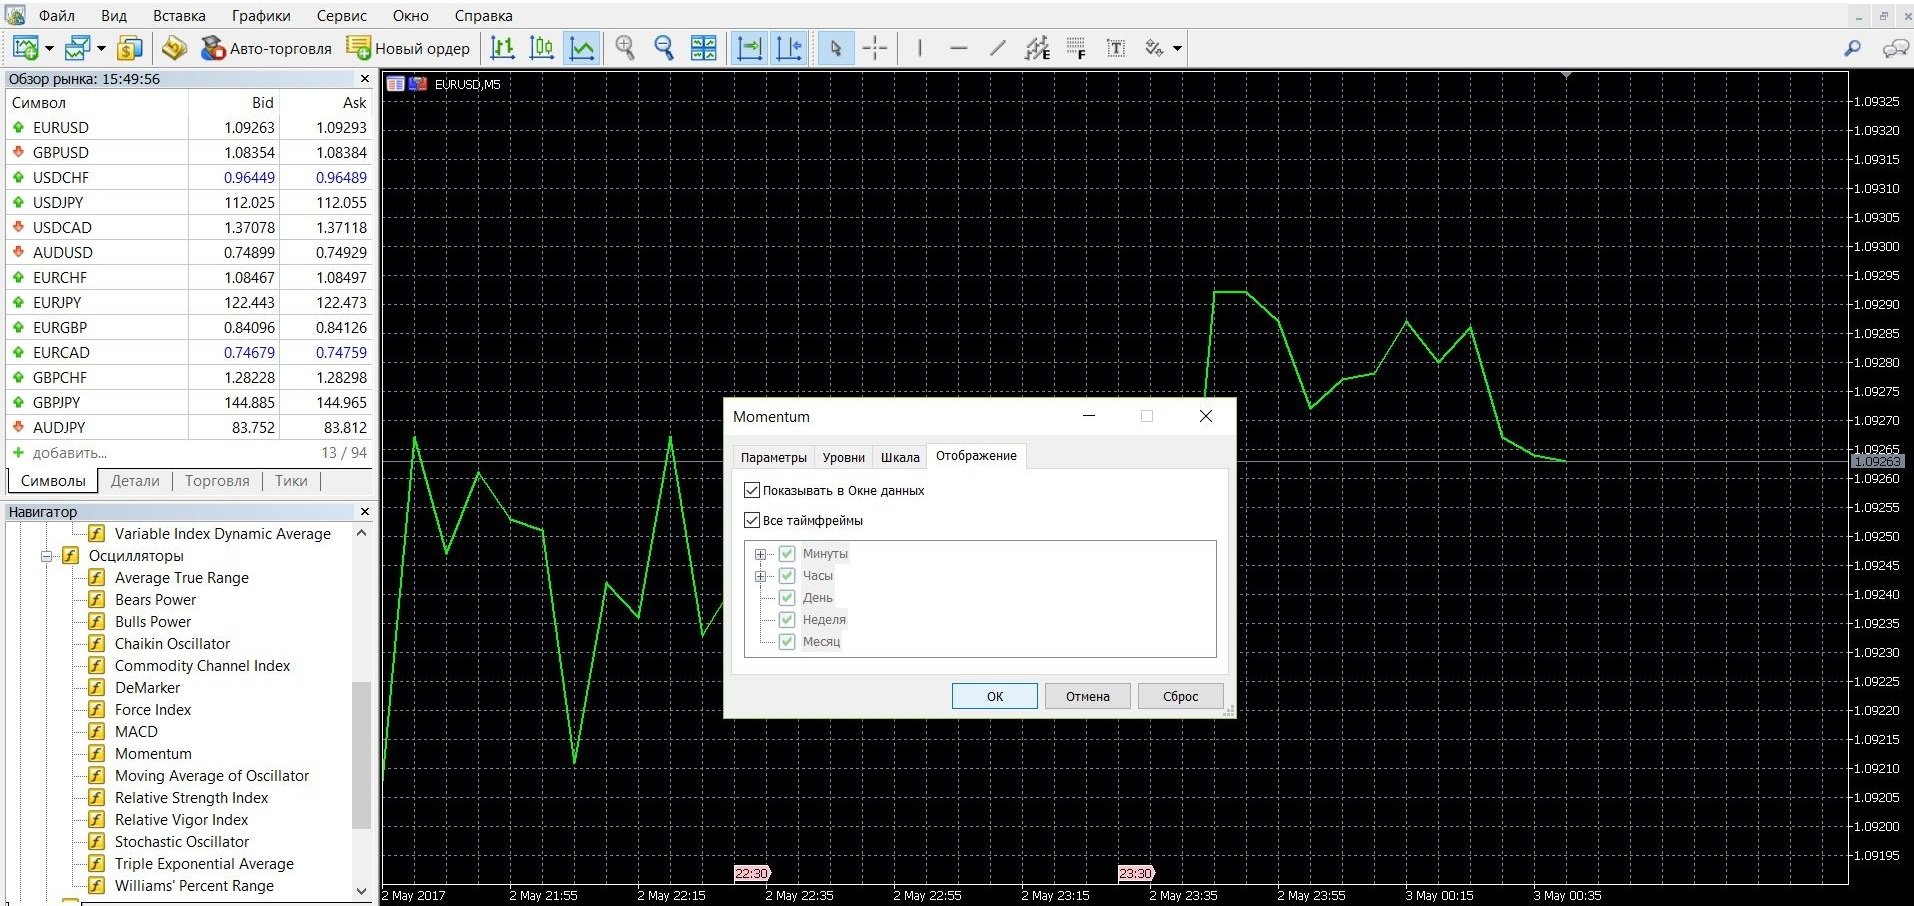
In the settings window, you have access to several parameters that you can adapt according to your trading strategy.
- Period – the standard value is “14”, you can change it: for long-term trading, a longer period is needed, in this case, the frequency of messages will be reduced, their quality will be better; You can reduce the value – then the signal will be more frequent, but then false signals are not excluded. Remember that increasing the period reduces the frequency of messages and improves their quality.
- Range of motion – values from -100 to +100 are indicated as standard. Thus, the indicator curve will move between these levels, demonstrating the direction of the current trend.
- Timeframes are the time intervals on which the indicator is allowed to be turned on.
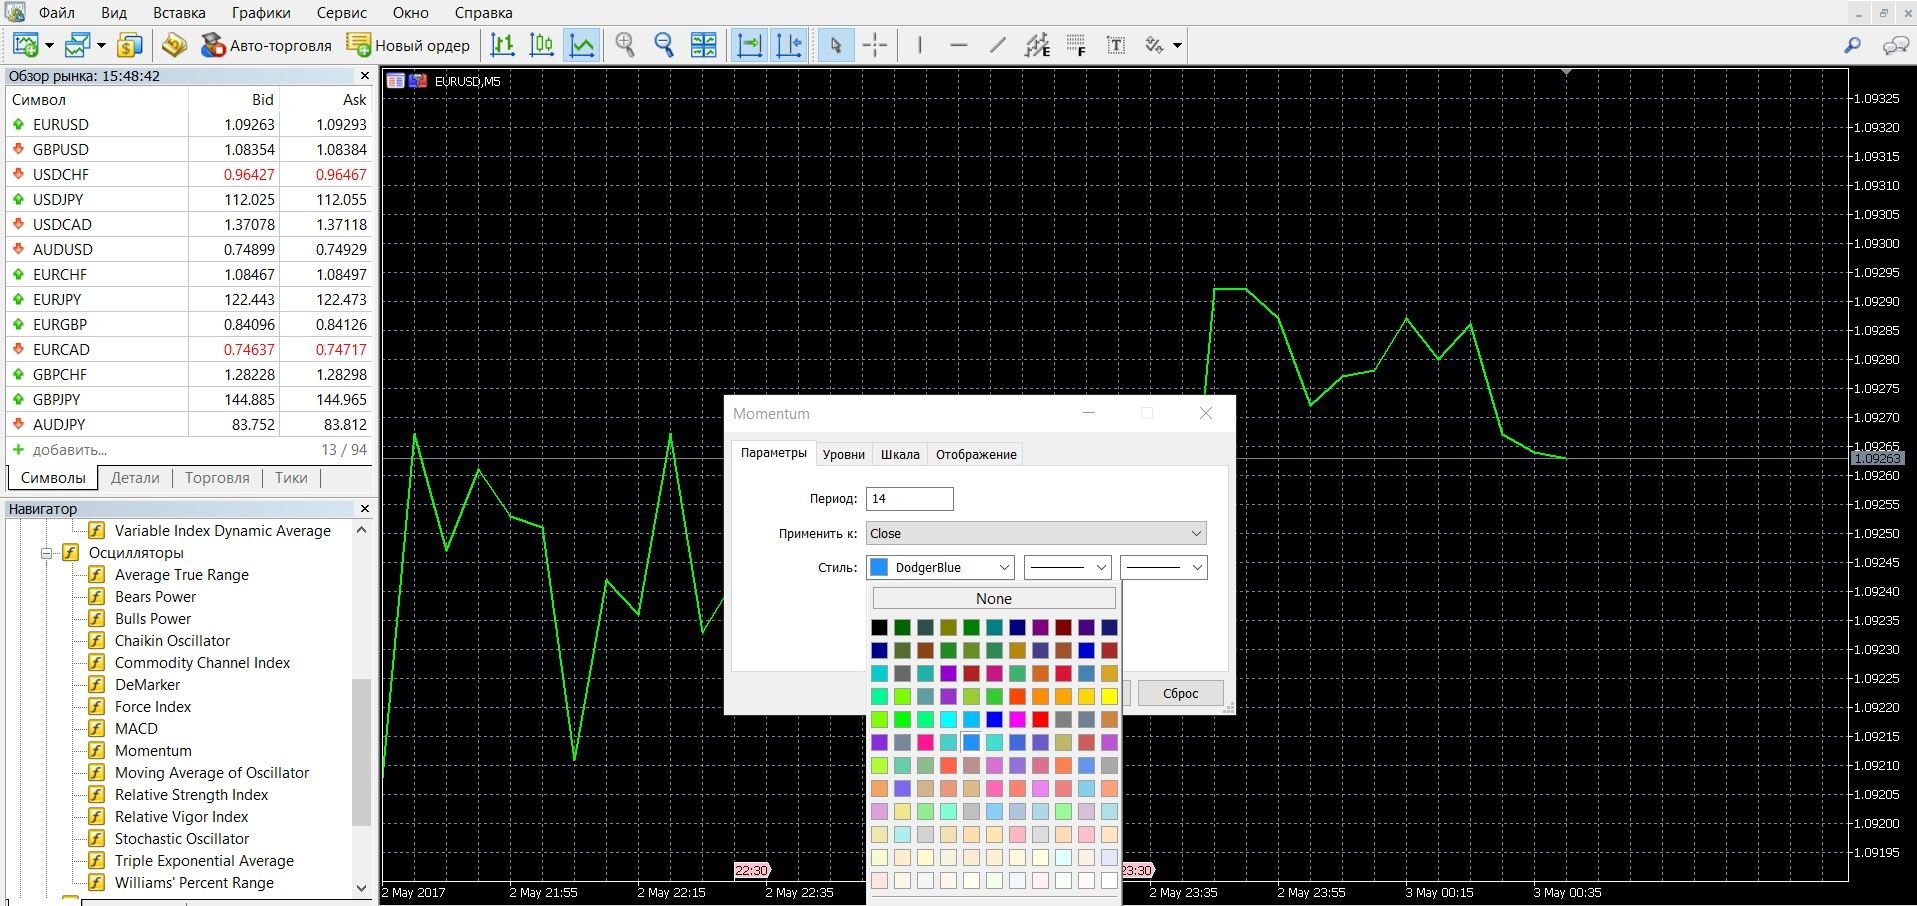
You can also change the resistance/support levels, the colors of the oscillator signal line curve, additional levels, and the colors of the lines. - “Apply to” – the price on the basis of which the indicator is built.
- “Fix minimum/maximum” – the width of the trading range.
If your platform does not have the Momentum indicator, you can download it here.
Application of the indicator for binary options
The Momentum indicator is a reliable assistant in binary options trading. By giving leading signals about the magnitude of price dynamics for a specific period, it will contribute to accurate forecasting of the trend, which means that it will bring a stable income with skillful use. Oscillators are of particular value in anticipating market dynamics, so using them in trading will greatly facilitate the work and making the right decisions. The difference between Momentum and other indicators is in the simple principle of operation and simple interpretation of signals, which will help, first of all, novice traders.
Today, the Tempo Indicator is also popular with professional market players, it is included in most trading platforms, strategies are built on the basis of its capabilities, where the indicator perfectly manifests itself, showing high quality signals for transactions. In the hands of a professional, this is a super-profitable tool that will help you achieve the maximum. Using the data of the oscillator, be careful and study its settings, since improper use, as well as the use of only this indicator in the work will lead to a false assessment of the currency situation and losses. Use several oscillators that you are comfortable working with. The importance of indicators for binary options trading is great, because they will help to draw the right conclusion about the upcoming market trend, and knowledge of the situation and the correct use of tools is in many ways already a success.
Rules for concluding transactions (screenshots)
Trading with a signal for a rise and fall in prices
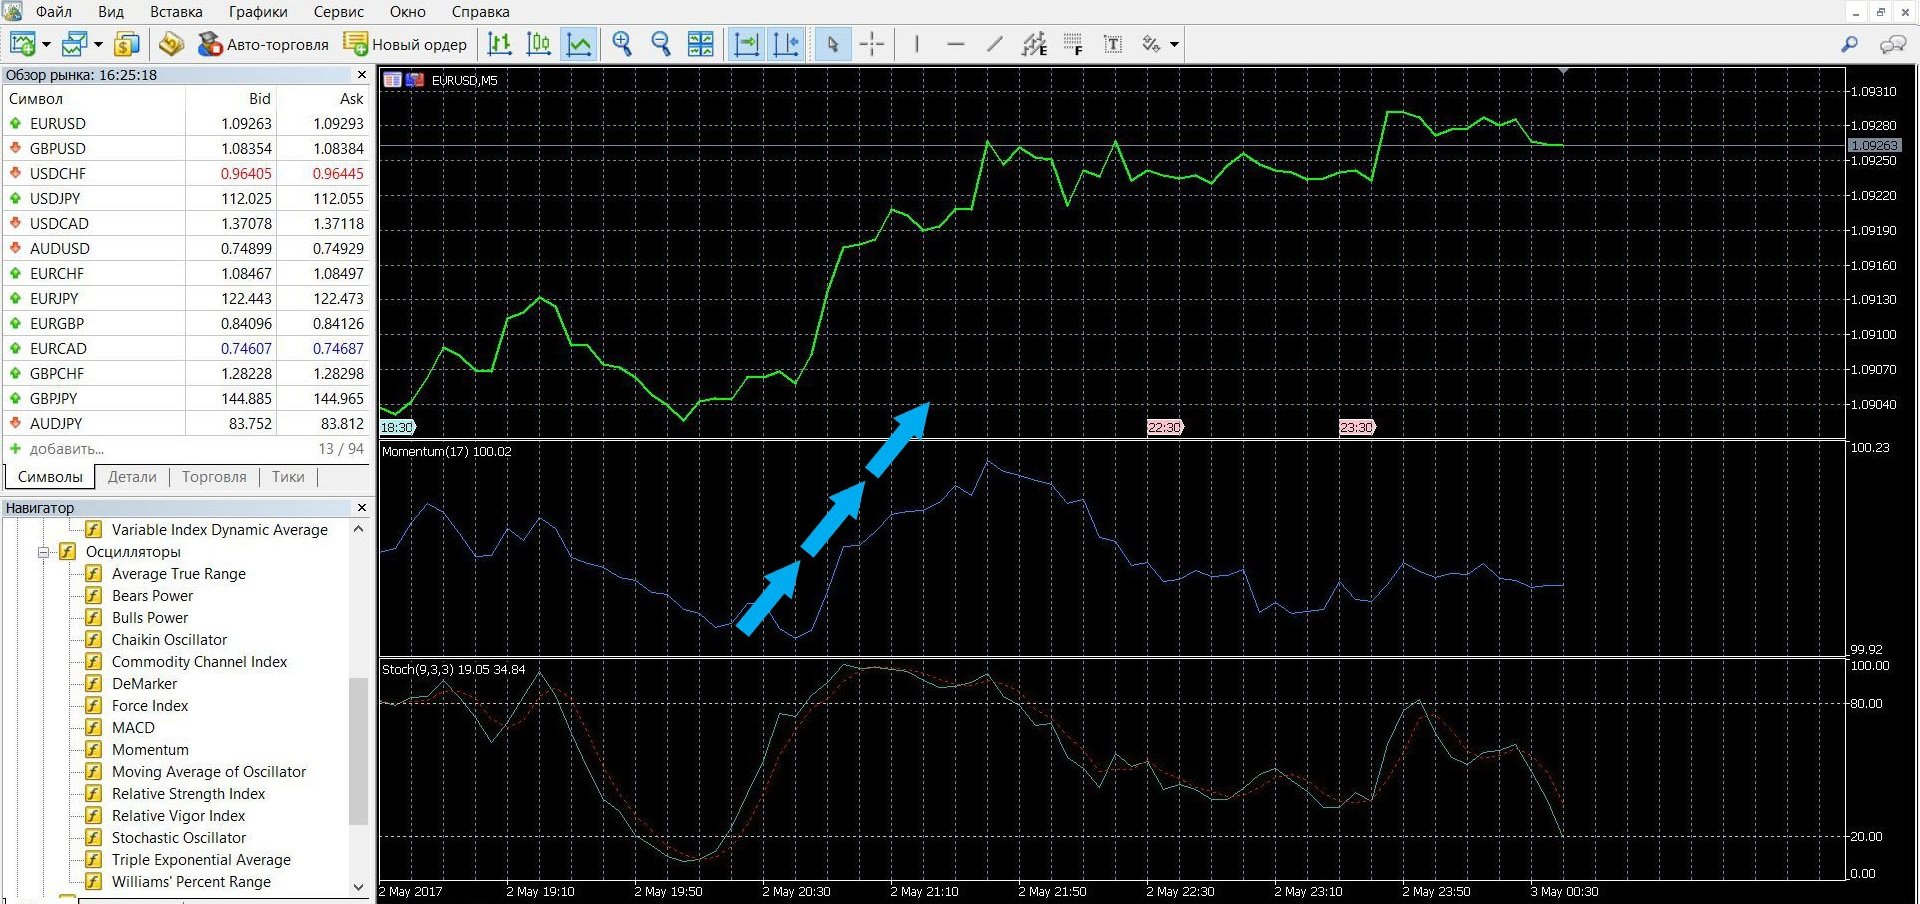
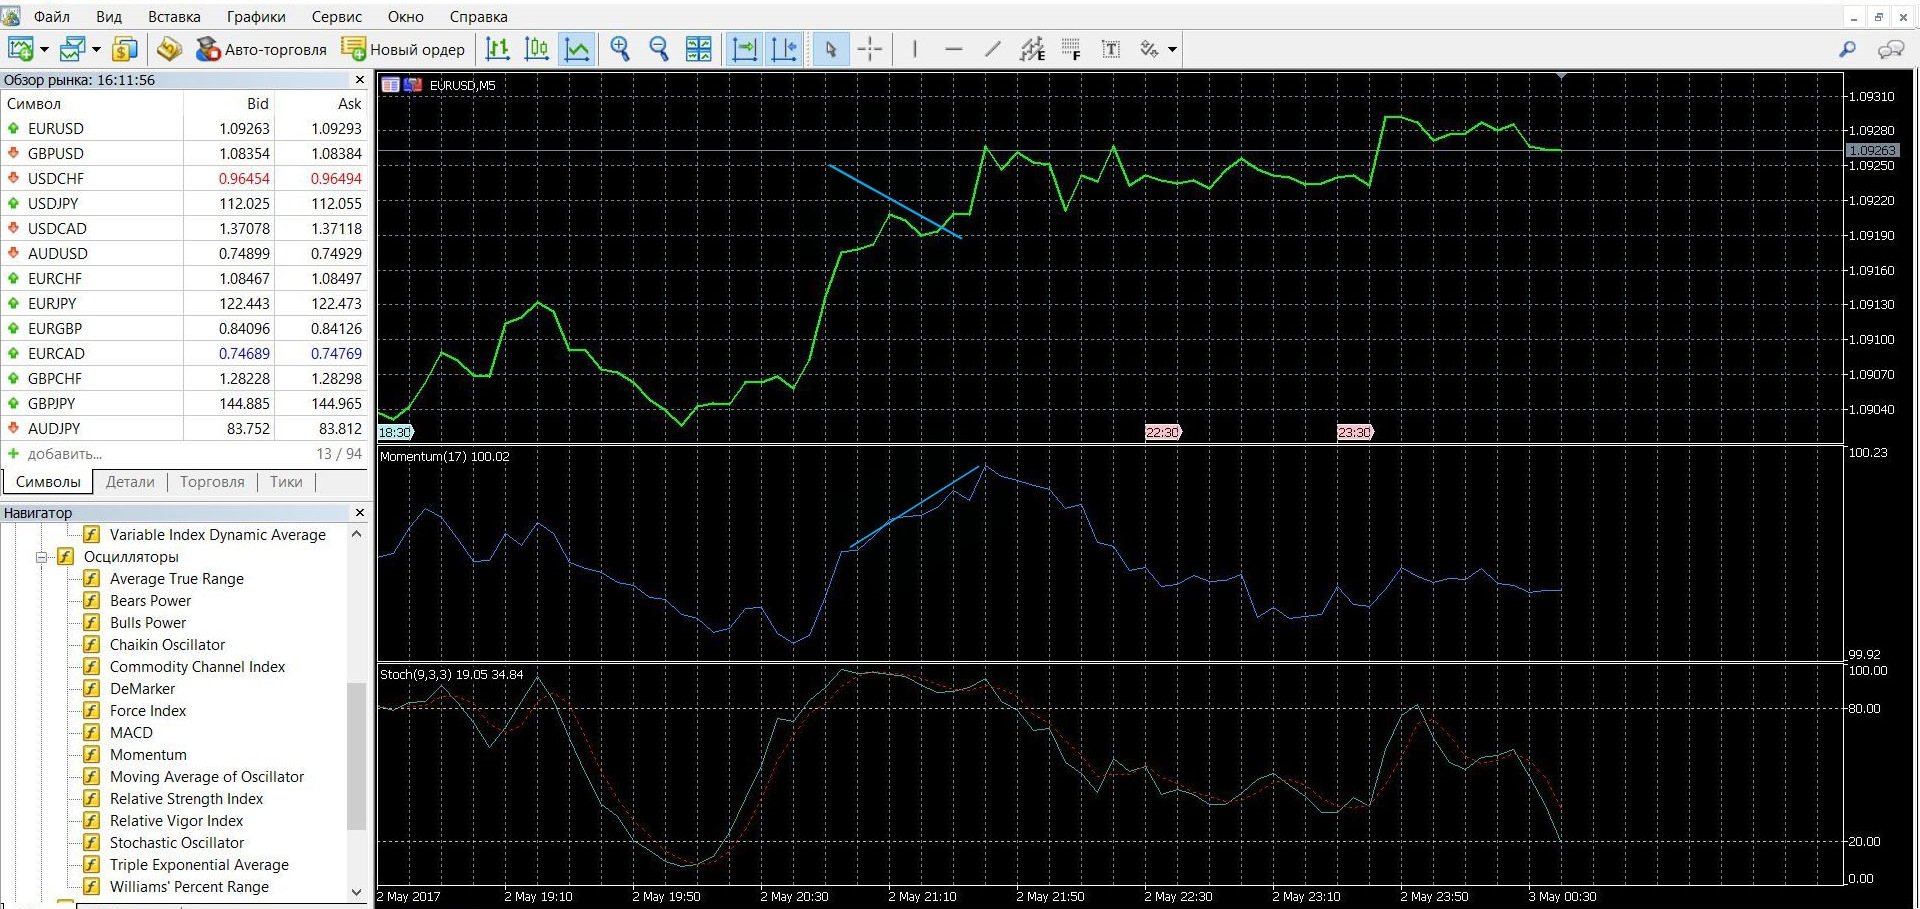
Below in the image you can see what the upward trend looks like on the MetaTrader 4 trading platform:
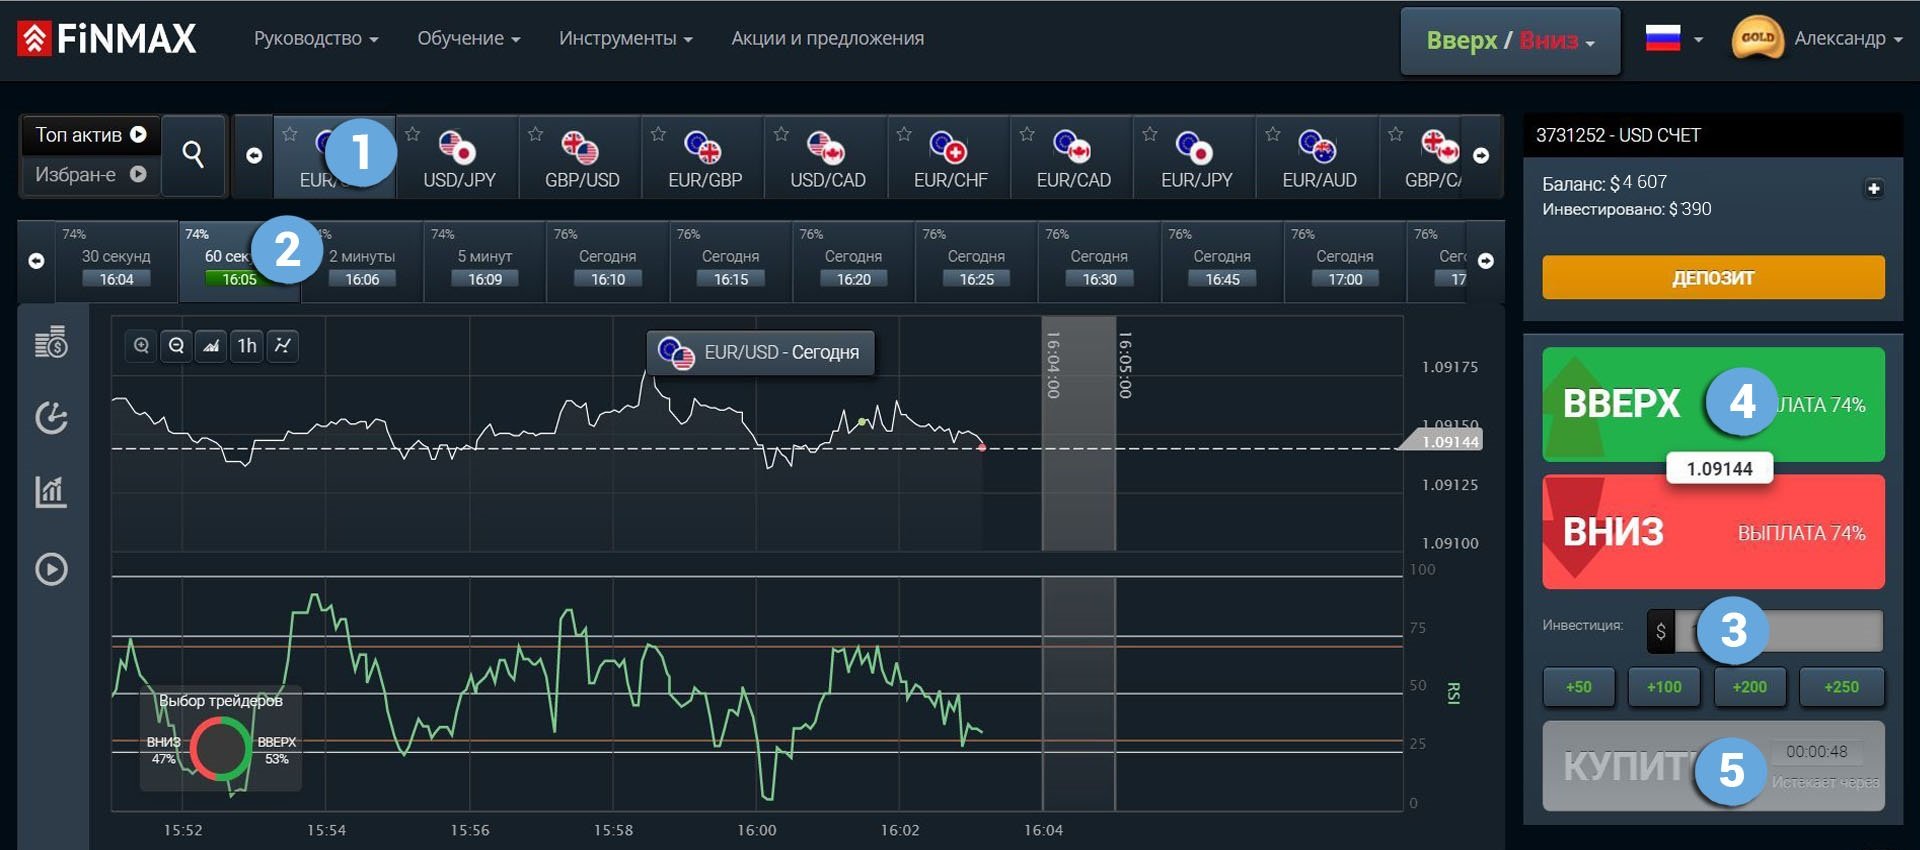
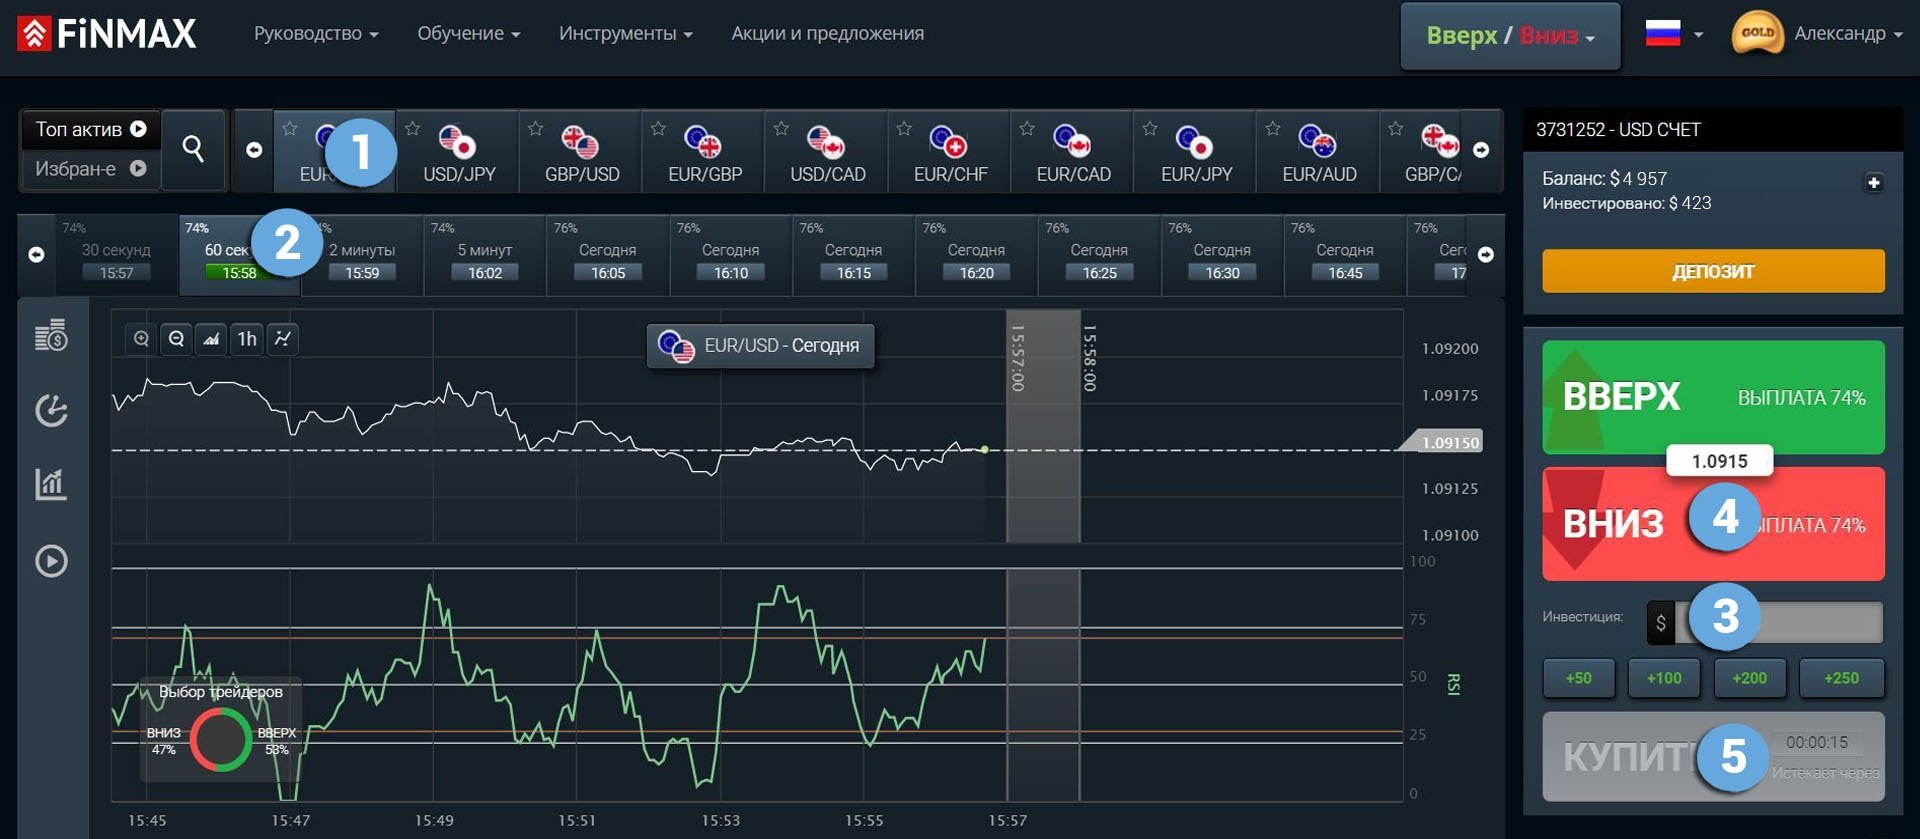
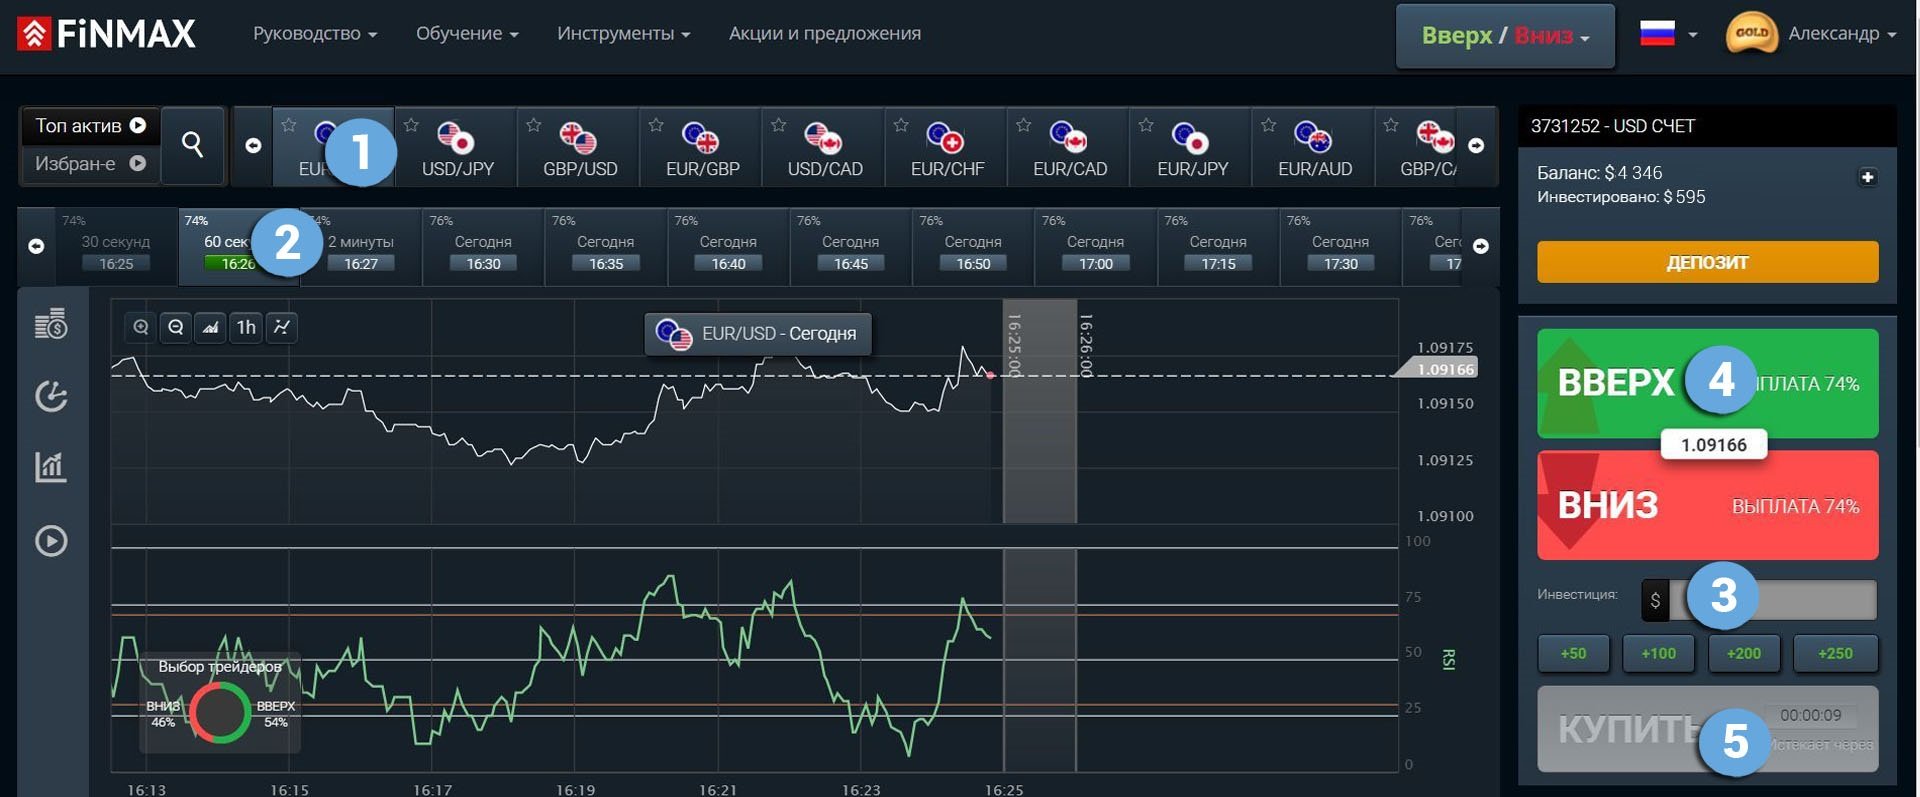
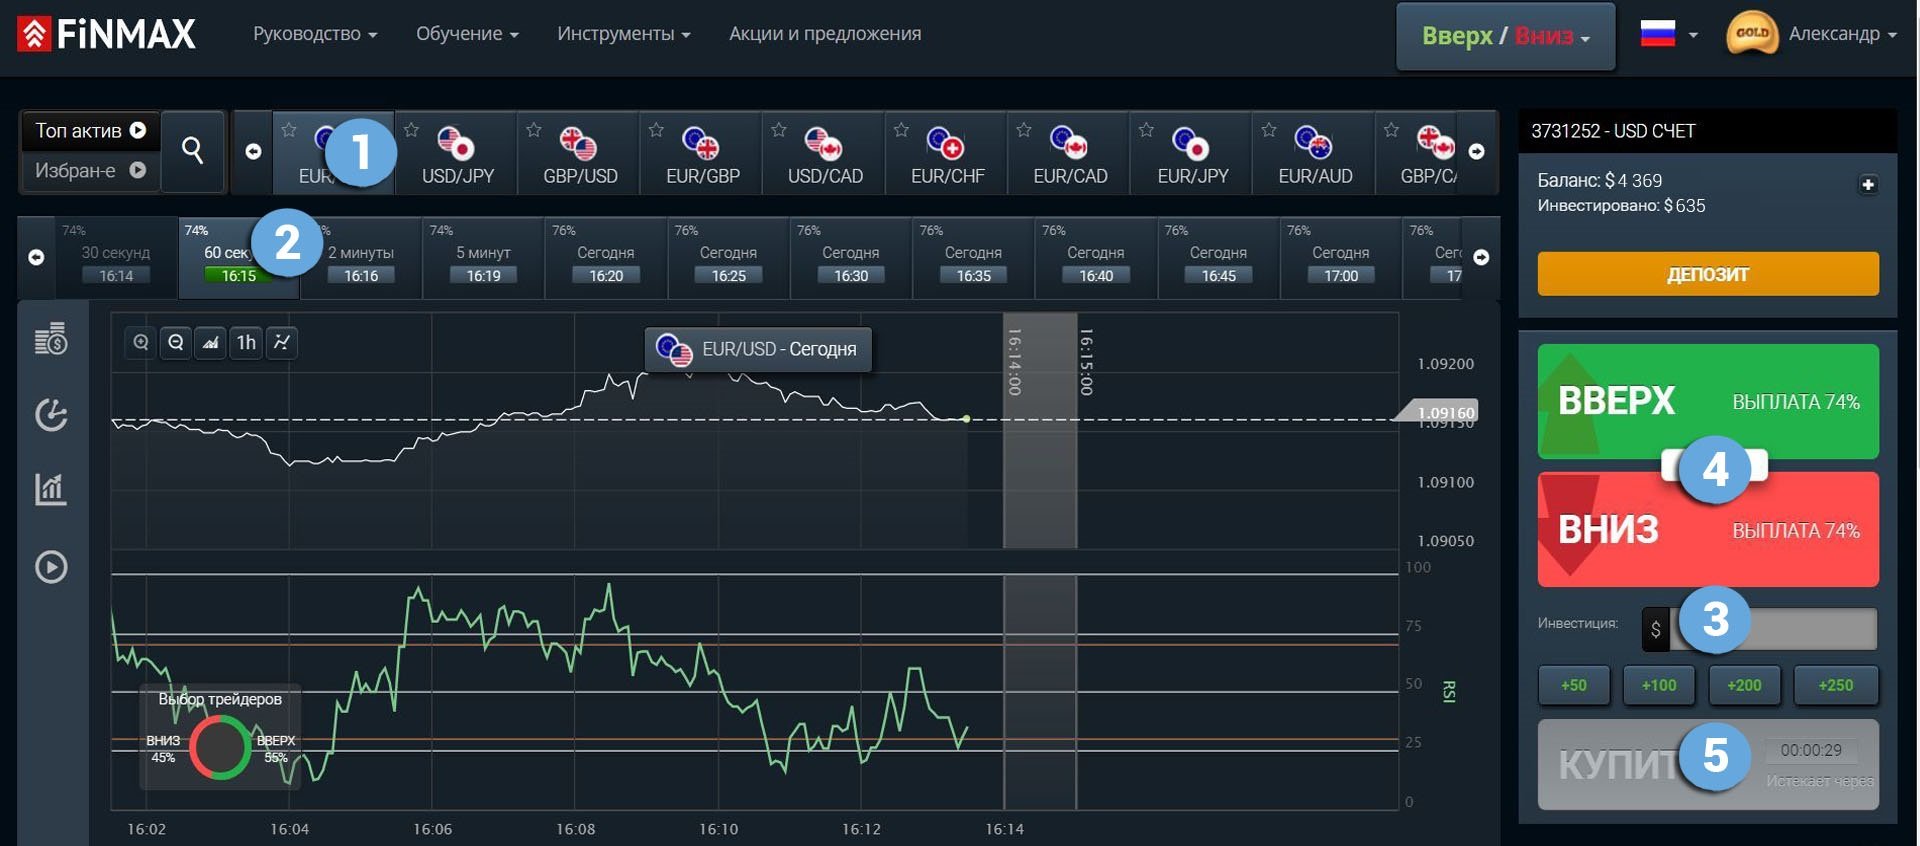
To take advantage of the upward price trend and place a CALL ( up) rate with the Finmax broker, go to the finmaxbo.com broker’s website and follow the steps below to prepare the option data. To do this, specify:
- Type of asset
- Option expiration
- The size of the bet
- Forecast of quote movement: UP
- Next, click the “buy” button and follow the results of currency movements on the chart
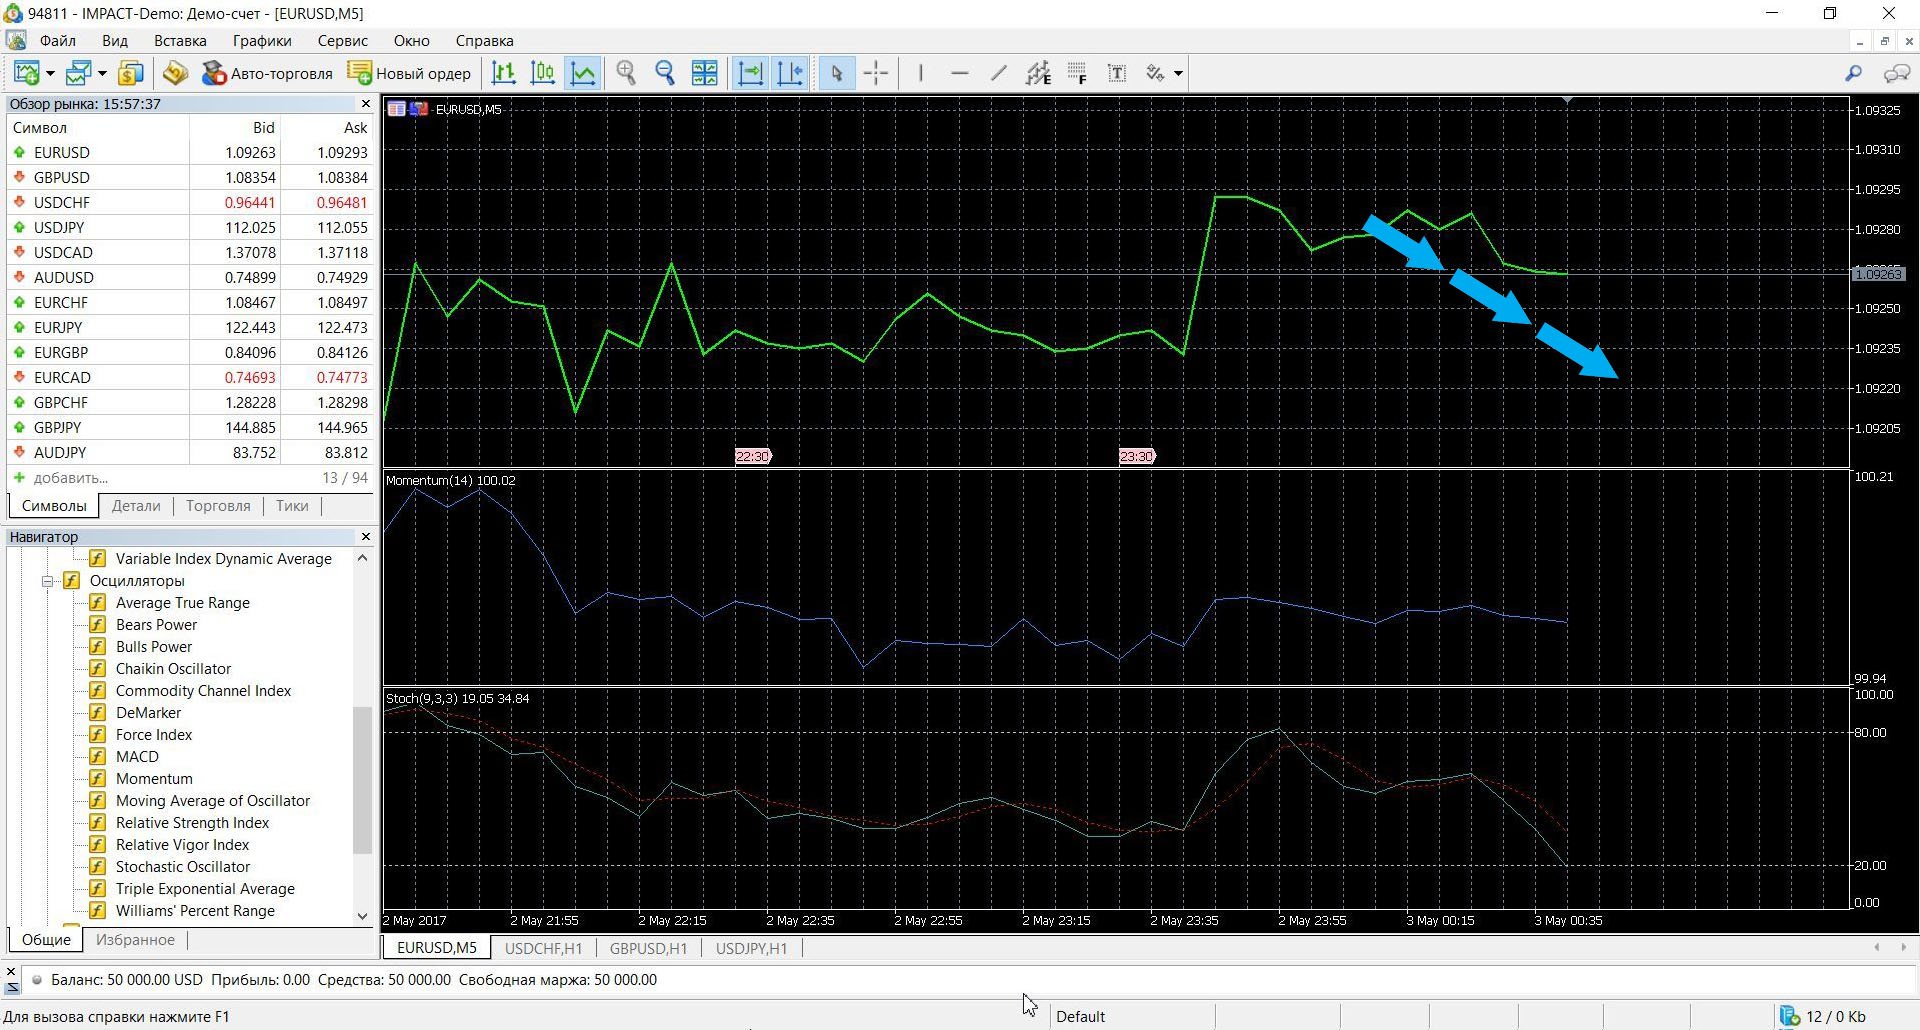
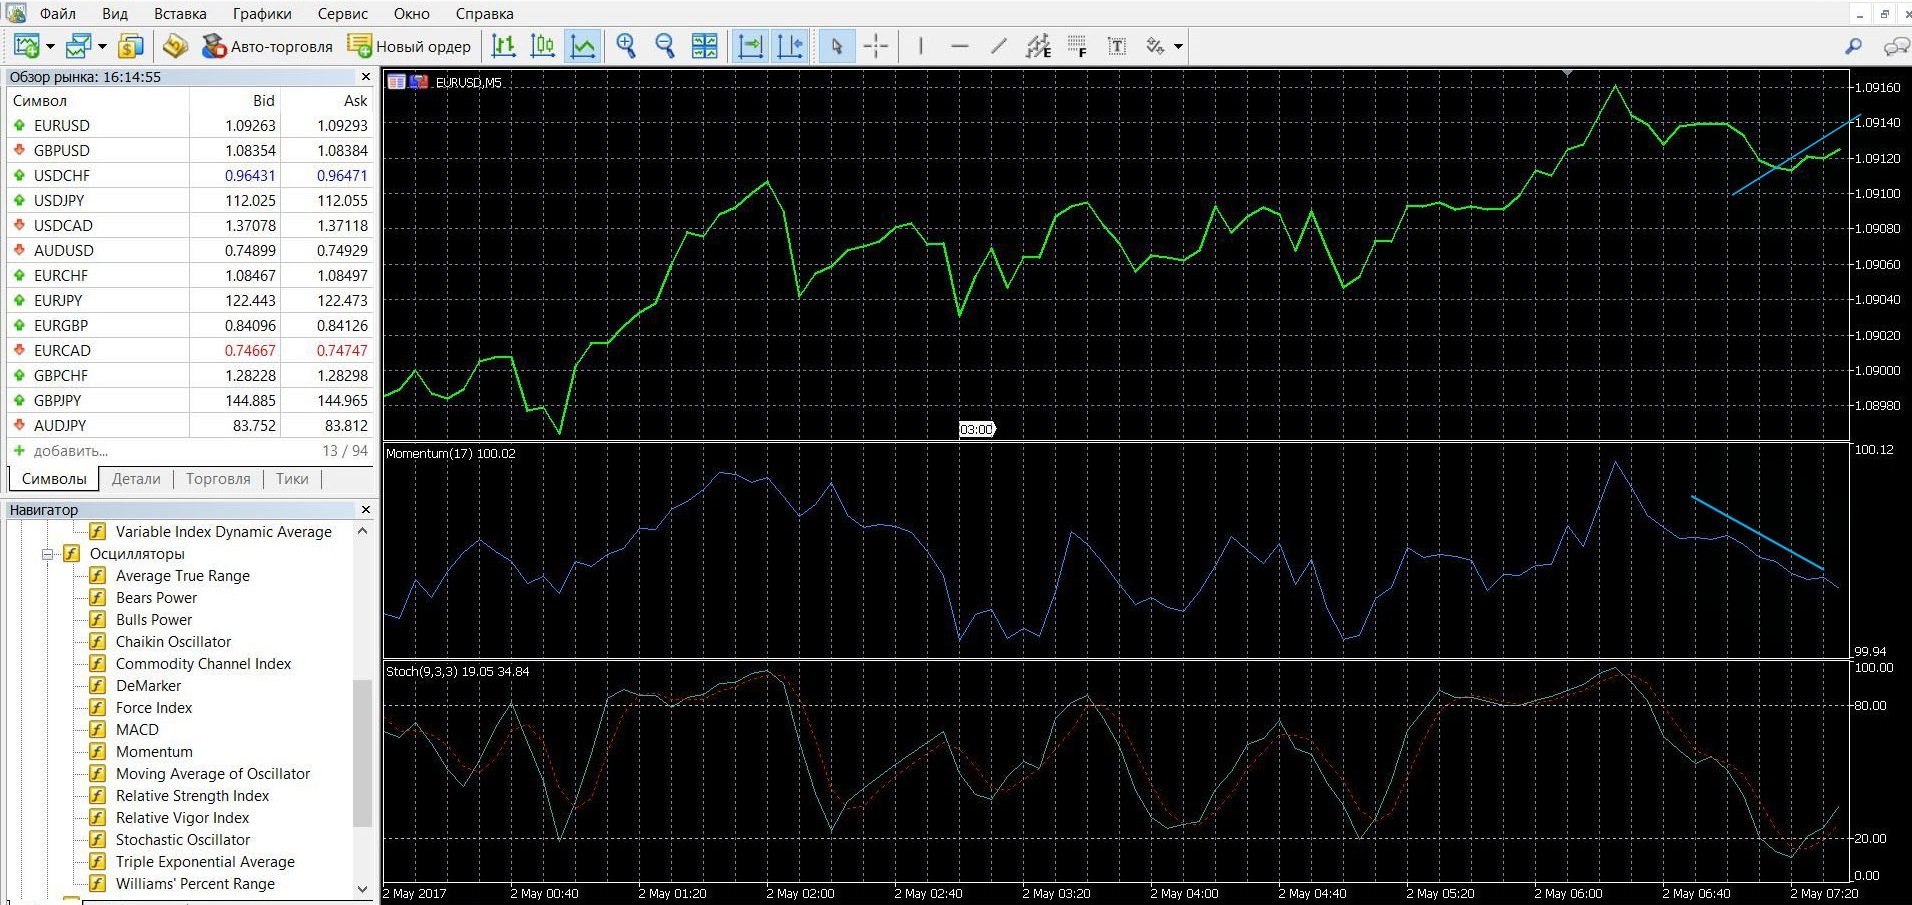
Below in the image you can see what the downward trend looks like on the MetaTrader 4 trading platform:
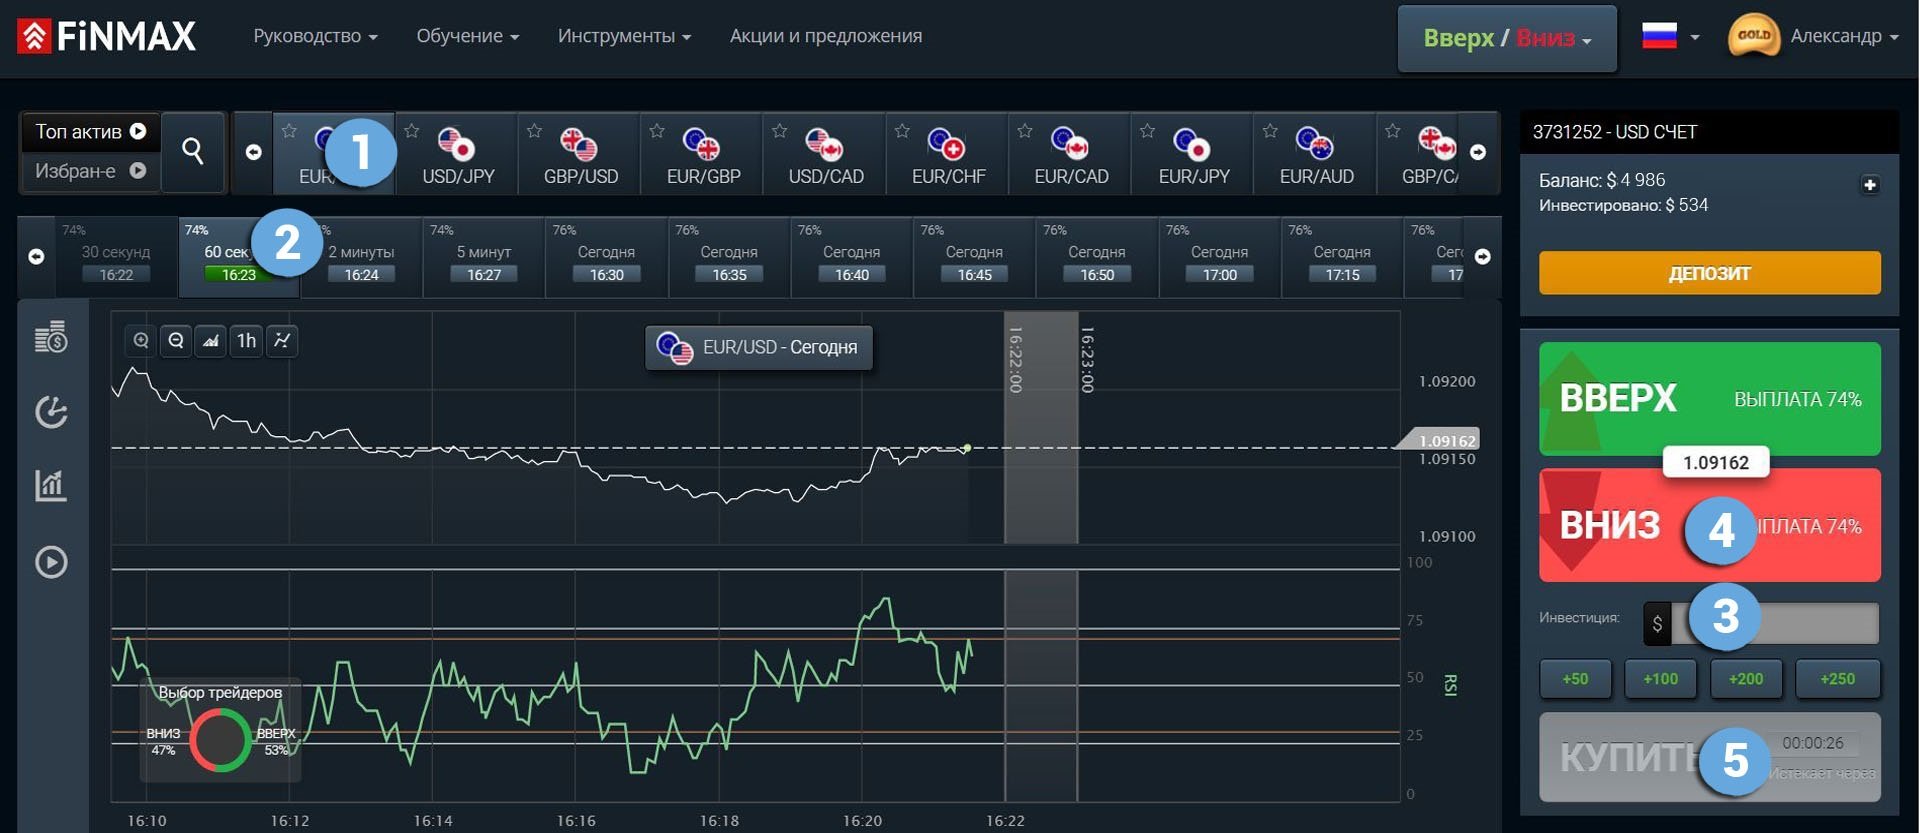
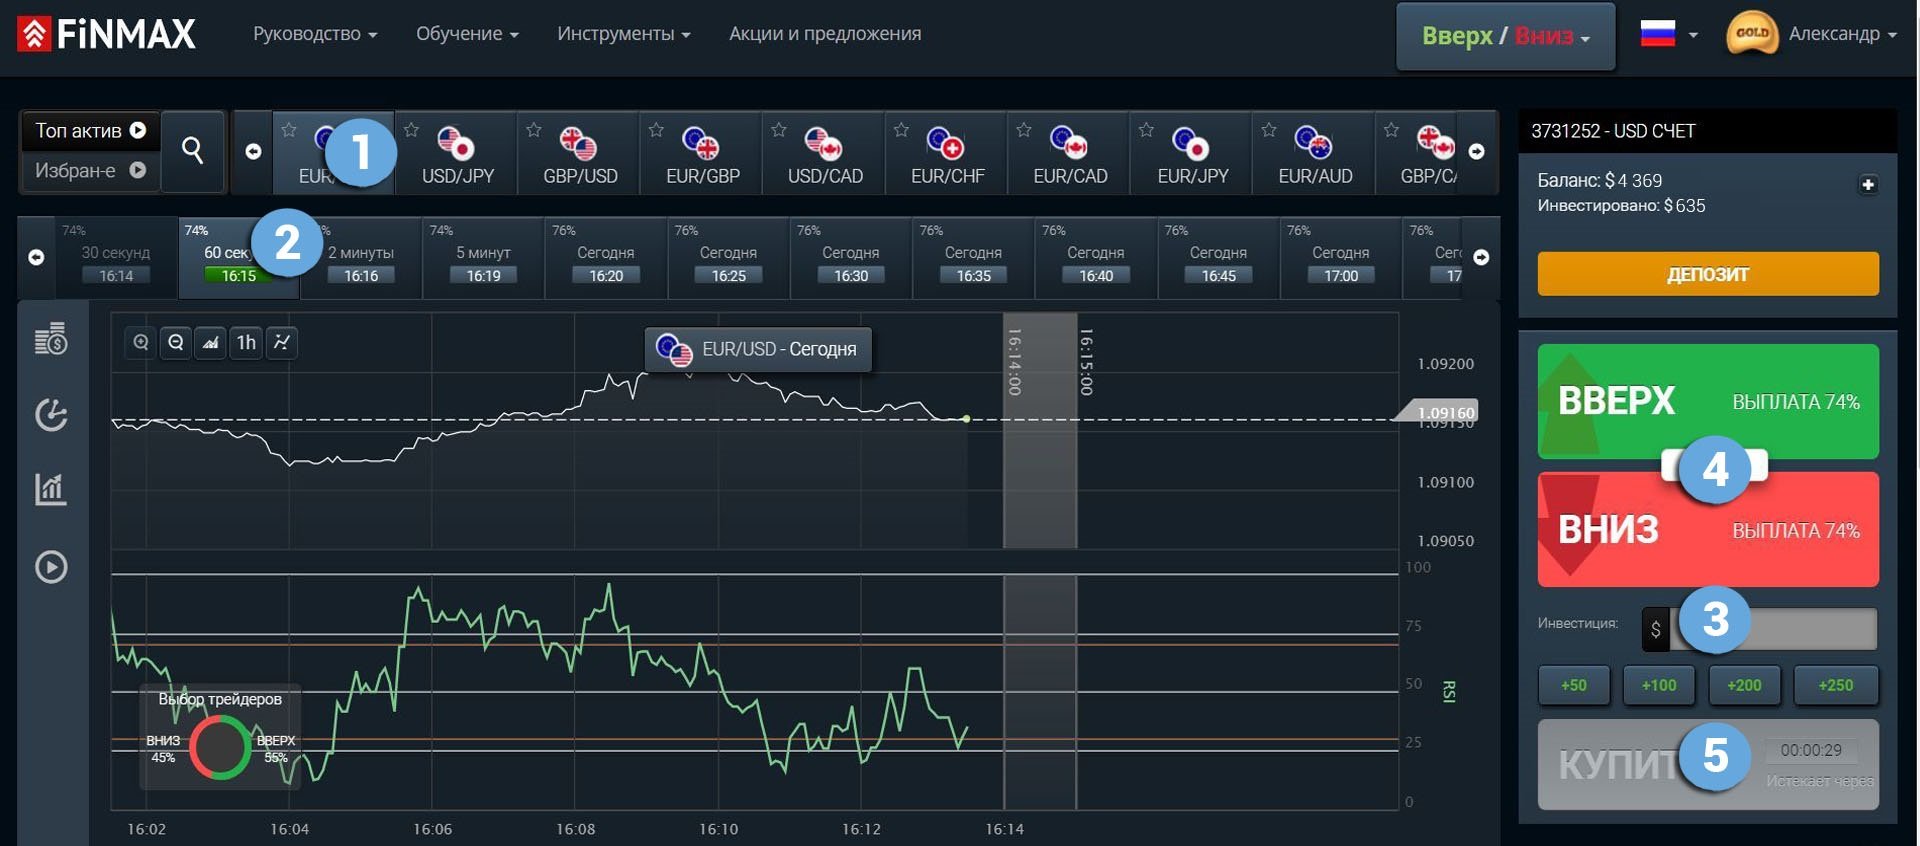
To take advantage of the downward price trend and place a PUT (down) rate with a Finmax broker, go to the finmaxbo.com broker’s website and follow the steps below to prepare the option data. To do this, specify:
- Type of asset
- Option expiration
- The size of the bet
- Forecast of quote movement: DOWN
- Next, click the “buy” button and follow the results of currency movements on the chart
Trading with an overbought-oversold signal
Working as an oscillator, Momentum allows you to trade with overbought-oversold signals. The peculiarity of the Tempo Indicator is the absence of fixed zones on the chart. To see the highs and lows during trading, add an additional convenient indicator to the chart (Stochastic, Bollinger Bands, etc.). When the indicator line is above the 80 mark, then moves to the range between 20 and 80, you have a signal to buy a put option:
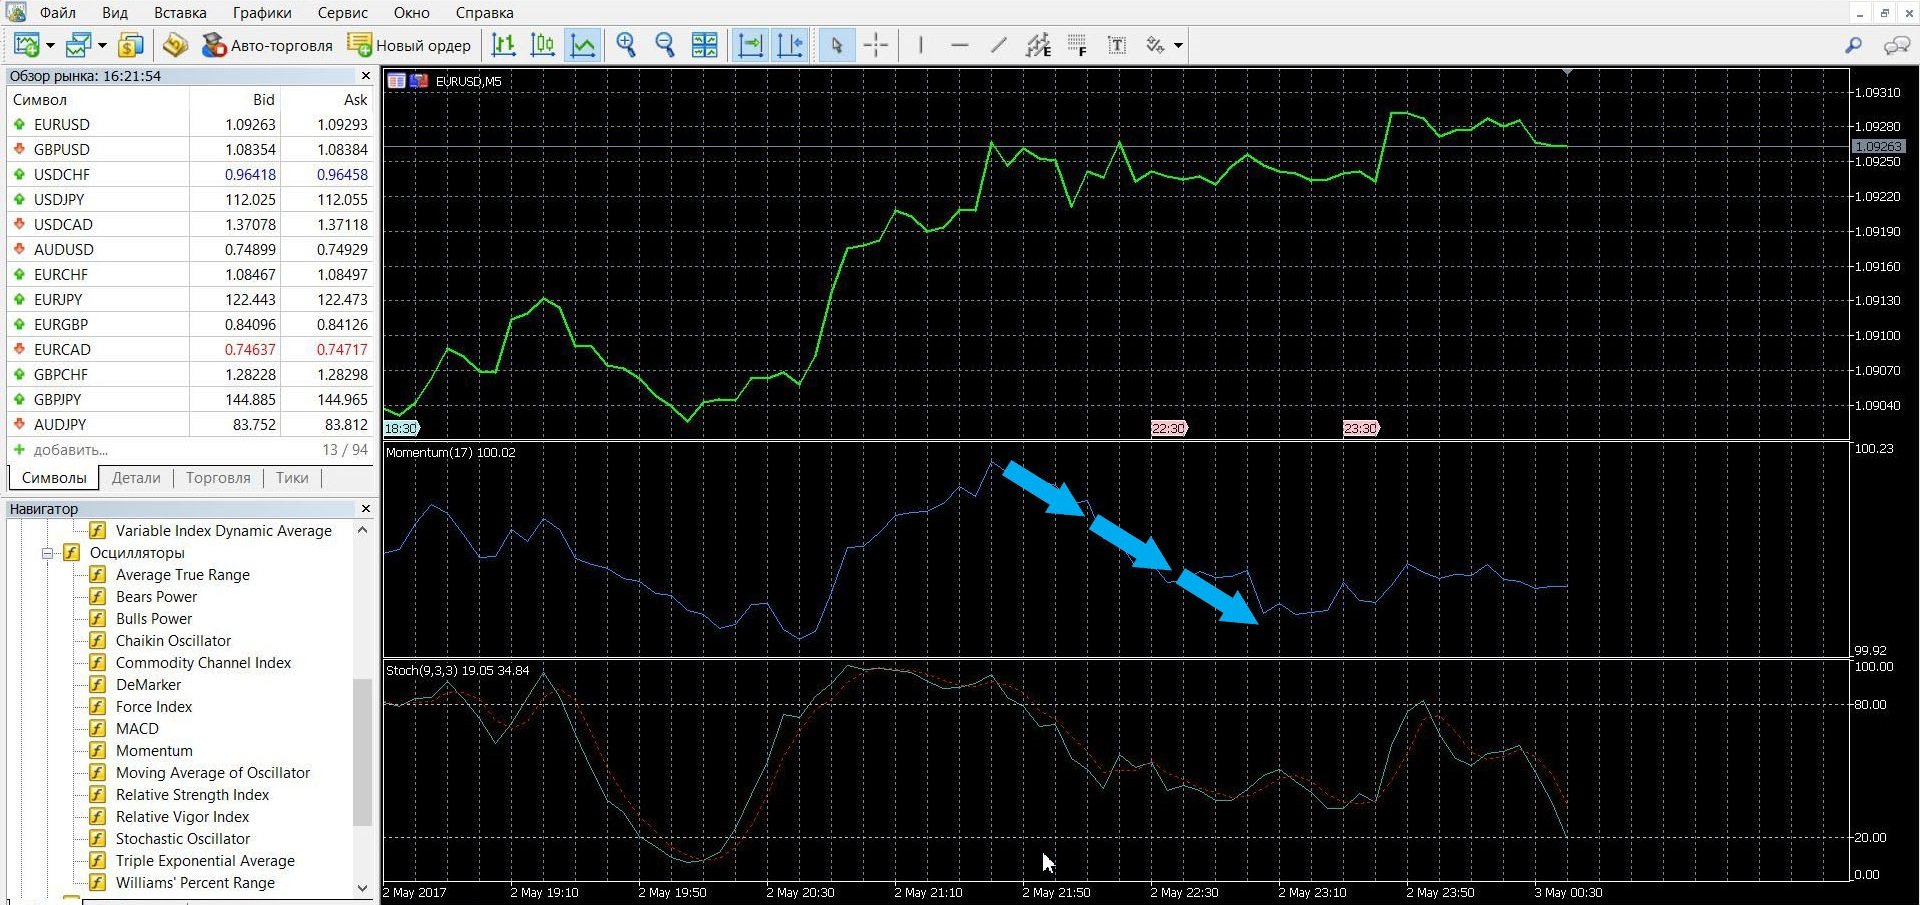
To take advantage of the downward price trend and place a PUT (down) rate with a Finmax broker, go to the finmaxbo.com broker’s website and follow the steps below to prepare the option data. To do this, specify:
- Type of asset
- Option expiration
- The size of the bet
- Forecast of quote movement: DOWN
- Next, click the “buy” button and follow the results of currency movements on the chart
When the indicator line is located below the 20 mark, then moves to the range of 20-80, here is a signal to buy a call option:
To take advantage of the upward price trend and place a CALL (up ) rate with the Finmax broker, go to the finmaxbo.com broker’s website and follow the steps below to prepare the option data. To do this, specify:
- Type of asset
- Option expiration
- The size of the bet
- Forecast of quote movement: UP
- Next, click the “buy” button and follow the results of currency movements on the chart
Trading in divergence
Divergence, that is, discrepancies between the indicator readings and the price, is a reliable buy signal, using which you will get the most out of trading. Divergence, unlike convergence, occurs in an uptrend, when the price on the chart sets new peaks, but the indicator does not, and warns of its completion. When in an uptrend the price goes one way and the Momentum line goes the other, it is a signal that the price movement is about to change. To determine the divergence in more detail, you can additionally use any convenient oscillator.
To take advantage of the divergence opportunities and place a bet with the Finmax broker, go to the finmaxbo.com broker’s website and follow the steps below to prepare the option data. To do this, specify:
- Type of asset
- Option expiration
- The size of the bet
- Forecast of quote movement
- Next, click the “buy” button and follow the results of currency movements on the chart
Convergence trading
Convergence is also a divergence between the readings of the indicator and the price but, unlike divergence, it occurs in a downtrend, when the price on the chart sets new peaks, but the indicator does not, and warns of its completion. When in a downtrend the price goes one way and the Momentum line goes the other, it is a signal that the price movement is about to change. To define convergence in more detail, you can additionally use any convenient oscillator.
To take advantage of the convergence opportunities and place a bet with the Finmax broker, go to the finmaxbo.com broker’s website and follow the steps below to prepare the option data. To do this, specify:
- Type of asset
- Option expiration
- The size of the bet
- Forecast of quote movement
- Next, click the “buy” button and follow the results of currency movements on the chart
Money management
Stable profitable trading is much more than two or three successful trades. Not every trader comes to such a conclusion and such a strategy. We can talk about profit when the management of funds is carried out consciously and thoughtfully. The art of money management distinguishes a professional from someone who sees nothing but a state of failure behind losses and an empty deposit. What to do? The answer is simple. Take money management seriously – the art of money management , which includes the following rules:
Minimum bet
When you start trading, don’t bet all your funds on one option. Start with the minimum bet value. So, you will not lose the entire amount at once and, in case of an unsuccessful outcome of the transaction, you will be able to participate in trading again.
Minimum deposit
When opening an account with a broker, do not deposit a large amount into it at once. Remember that the outcome of trading is unpredictable and there will always be risks of losing funds. Take care of your money and spend it skillfully.
Take care of your money
Manage your funds wisely, trade consciously: do not put all your money in one transaction; Do not bet more than 5% of the deposit on one transaction. In case of an unsuccessful transaction, you will need money in order to continue trading.
Minimum number of assets
When starting a trade, gradually increase the number of tradable assets. Master the system, get acquainted with trading in detail, try to start trading with one or two assets and gradually be able to connect other assets: currency, futures, stocks, etc. Remember that a large number of transactions is a burden on your funds, on your deposit, and you may not notice how you lose money.
Minimal emotions
In trading, it is important not only to be a professional and have experience of successful transactions, it is important to keep your emotions under control and not succumb to them in any outcome. If you look at the statistics, three failed trades are enough, and you will start to panic and try to get your money back. Remember the rule of three: after three trades, whether successful or not, stop trading. So, you learn self-control and save your money, which will bring you even more income with a reasonable approach. Money management, as one of the elements of a successful trader, will make your trading truly successful.
Expiration
Expiration of binary options (from English Expiration) – the end of the transaction, when the price of the asset rises or falls, the fulfillment of obligations will occur, that is, the transfer of funds to the bidder. Every binary trader thinks about the role of expiration in the outcome of the transaction and for good reason. It is on what expiration period you specify, the income will depend. Expiration dates can be from a minute to more than a month. That’s why binary options are so popular – in a minute you can get income.
Depending on the expiration date, binary options are divided into:
- Short-term – with a maturity of less than an hour (for example, now “60 seconds” options are especially popular among beginners). Trading such options is high-risk, as it is difficult to predict market dynamics.
- Long-term – with a longer execution period: from a week to more than a month. These options are popular with professional traders who play on the stock exchange for the sake of a full income. In this case, before placing a bet, it is necessary to analyze in detail the behavior of the asset, do not forget about the macroeconomic reasons for changing market trends.
Is it possible to extend the expiration of options?
It’s possible. Some brokers allow market players to change the expiration date. Extension of the expiration period is possible only in the direction of its increase; To extend the deadline, you need to deposit funds – approximately 40% of the rate.
Expiration rules:
- If you are new to options trading, when participating in a trade, choose a long expiration date.
- Work with a broker that allows you to increase the expiration time, this will help minimize the risks of possible unsuccessful transactions.
- In order to get a quick income in just a minute, participate in short-term (from a minute to several hours) trading. Do not forget that such trading is characterized by risks.
- In order to receive a large stable income, participate in long-term trading (from a week or more than a month). Such trading is characterized by high profitability, and it is easier to predict the outcome of the transaction: with the help of strategy, trading conditions (economy, news).
Expiration and financial losses
Always remember that expiration is always an unplanned loss, be prepared for this. It is difficult and almost impossible to predict the outcome of the transaction, as well as what events will affect it. The market is characterized by high dynamics and trends are constantly changing. To protect yourself, keep a reserve of funds that will help you recover the funds in case of failure.

